Zimbabwean vs Panamanian Median Male Earnings
COMPARE
Zimbabwean
Panamanian
Median Male Earnings
Median Male Earnings Comparison
Zimbabweans
Panamanians
$56,302
MEDIAN MALE EARNINGS
85.5/ 100
METRIC RATING
139th/ 347
METRIC RANK
$52,835
MEDIAN MALE EARNINGS
16.5/ 100
METRIC RATING
203rd/ 347
METRIC RANK
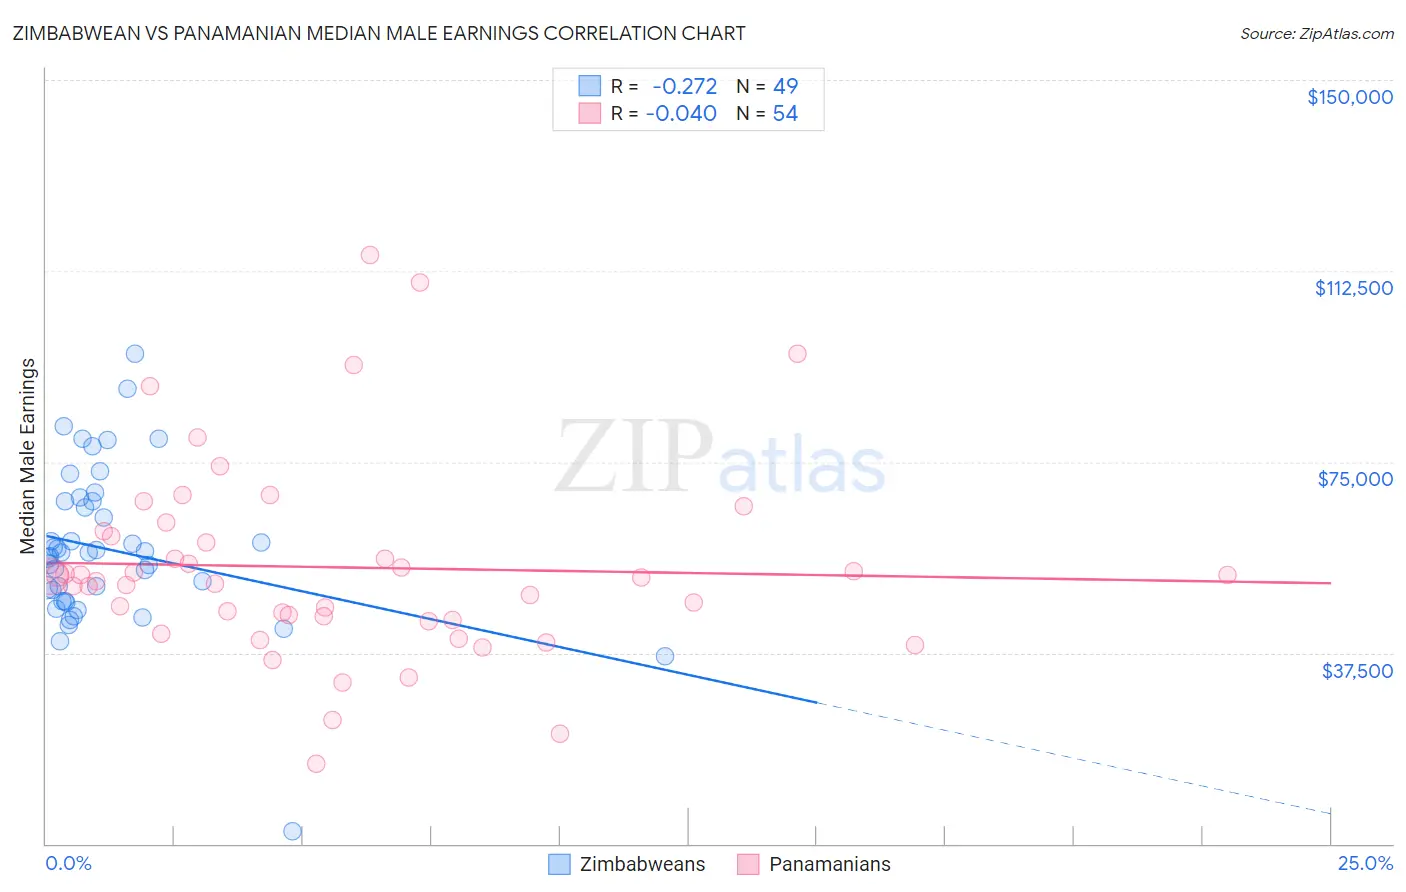
Zimbabwean vs Panamanian Median Male Earnings Correlation Chart
The statistical analysis conducted on geographies consisting of 69,206,147 people shows a weak negative correlation between the proportion of Zimbabweans and median male earnings in the United States with a correlation coefficient (R) of -0.272 and weighted average of $56,302. Similarly, the statistical analysis conducted on geographies consisting of 281,209,556 people shows no correlation between the proportion of Panamanians and median male earnings in the United States with a correlation coefficient (R) of -0.040 and weighted average of $52,835, a difference of 6.6%.
Median Male Earnings Correlation Summary
| Measurement | Zimbabwean | Panamanian |
| Minimum | $2,499 | $15,735 |
| Maximum | $96,250 | $115,625 |
| Range | $93,751 | $99,890 |
| Mean | $57,721 | $54,298 |
| Median | $57,093 | $51,973 |
| Interquartile 25% (IQ1) | $47,581 | $43,917 |
| Interquartile 75% (IQ3) | $67,190 | $60,350 |
| Interquartile Range (IQR) | $19,609 | $16,433 |
| Standard Deviation (Sample) | $15,546 | $19,573 |
| Standard Deviation (Population) | $15,387 | $19,391 |
Similar Demographics by Median Male Earnings
Demographics Similar to Zimbabweans by Median Male Earnings
In terms of median male earnings, the demographic groups most similar to Zimbabweans are Luxembourger ($56,300, a difference of 0.0%), Slovak ($56,306, a difference of 0.010%), Danish ($56,246, a difference of 0.10%), Ethiopian ($56,243, a difference of 0.10%), and Slavic ($56,390, a difference of 0.16%).
| Demographics | Rating | Rank | Median Male Earnings |
| Czechs | 88.2 /100 | #132 | Excellent $56,546 |
| Immigrants | Germany | 88.2 /100 | #133 | Excellent $56,542 |
| Moroccans | 87.7 /100 | #134 | Excellent $56,499 |
| Irish | 87.4 /100 | #135 | Excellent $56,464 |
| Immigrants | Saudi Arabia | 87.2 /100 | #136 | Excellent $56,452 |
| Slavs | 86.5 /100 | #137 | Excellent $56,390 |
| Slovaks | 85.5 /100 | #138 | Excellent $56,306 |
| Zimbabweans | 85.5 /100 | #139 | Excellent $56,302 |
| Luxembourgers | 85.5 /100 | #140 | Excellent $56,300 |
| Danes | 84.8 /100 | #141 | Excellent $56,246 |
| Ethiopians | 84.8 /100 | #142 | Excellent $56,243 |
| Sri Lankans | 83.4 /100 | #143 | Excellent $56,136 |
| Immigrants | Uganda | 82.4 /100 | #144 | Excellent $56,064 |
| Norwegians | 80.9 /100 | #145 | Excellent $55,965 |
| Immigrants | Chile | 80.7 /100 | #146 | Excellent $55,954 |
Demographics Similar to Panamanians by Median Male Earnings
In terms of median male earnings, the demographic groups most similar to Panamanians are Immigrants from Uruguay ($52,860, a difference of 0.050%), Ghanaian ($52,810, a difference of 0.050%), Immigrants from Bosnia and Herzegovina ($52,869, a difference of 0.060%), Immigrants from Thailand ($52,908, a difference of 0.14%), and Immigrants from Colombia ($52,725, a difference of 0.21%).
| Demographics | Rating | Rank | Median Male Earnings |
| Immigrants | Africa | 26.6 /100 | #196 | Fair $53,457 |
| Immigrants | Kenya | 26.0 /100 | #197 | Fair $53,427 |
| Immigrants | Costa Rica | 22.6 /100 | #198 | Fair $53,237 |
| Tongans | 22.3 /100 | #199 | Fair $53,218 |
| Immigrants | Thailand | 17.5 /100 | #200 | Poor $52,908 |
| Immigrants | Bosnia and Herzegovina | 16.9 /100 | #201 | Poor $52,869 |
| Immigrants | Uruguay | 16.8 /100 | #202 | Poor $52,860 |
| Panamanians | 16.5 /100 | #203 | Poor $52,835 |
| Ghanaians | 16.1 /100 | #204 | Poor $52,810 |
| Immigrants | Colombia | 15.0 /100 | #205 | Poor $52,725 |
| Immigrants | Iraq | 14.5 /100 | #206 | Poor $52,681 |
| Vietnamese | 12.7 /100 | #207 | Poor $52,525 |
| Venezuelans | 12.5 /100 | #208 | Poor $52,510 |
| Bermudans | 12.1 /100 | #209 | Poor $52,465 |
| Delaware | 11.5 /100 | #210 | Poor $52,412 |