Zimbabwean vs Immigrants from Bosnia and Herzegovina Median Earnings
COMPARE
Zimbabwean
Immigrants from Bosnia and Herzegovina
Median Earnings
Median Earnings Comparison
Zimbabweans
Immigrants from Bosnia and Herzegovina
$48,229
MEDIAN EARNINGS
92.6/ 100
METRIC RATING
130th/ 347
METRIC RANK
$45,600
MEDIAN EARNINGS
23.7/ 100
METRIC RATING
208th/ 347
METRIC RANK
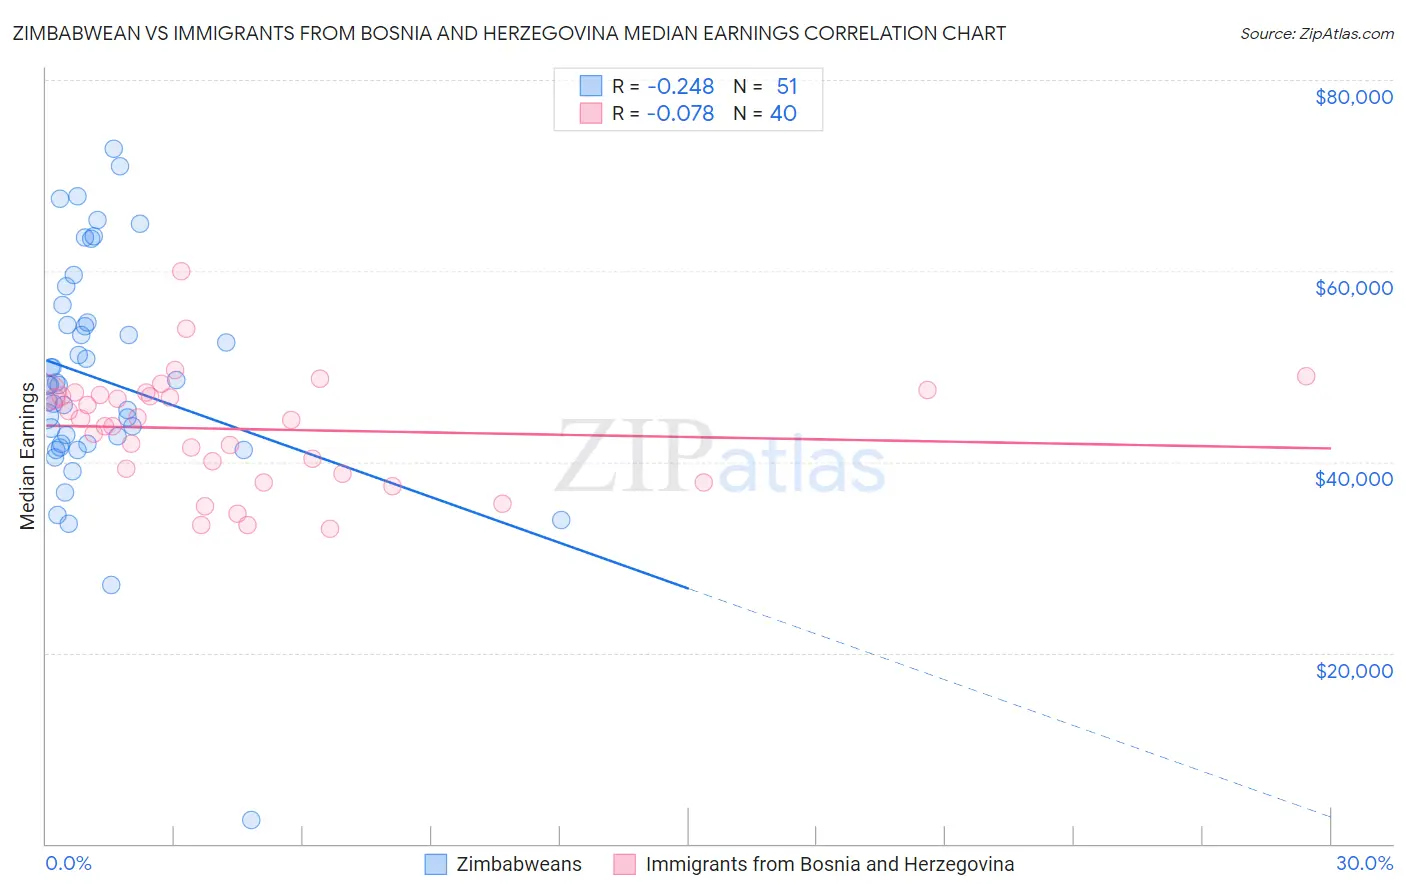
Zimbabwean vs Immigrants from Bosnia and Herzegovina Median Earnings Correlation Chart
The statistical analysis conducted on geographies consisting of 69,206,617 people shows a weak negative correlation between the proportion of Zimbabweans and median earnings in the United States with a correlation coefficient (R) of -0.248 and weighted average of $48,229. Similarly, the statistical analysis conducted on geographies consisting of 156,807,140 people shows a slight negative correlation between the proportion of Immigrants from Bosnia and Herzegovina and median earnings in the United States with a correlation coefficient (R) of -0.078 and weighted average of $45,600, a difference of 5.8%.
Median Earnings Correlation Summary
| Measurement | Zimbabwean | Immigrants from Bosnia and Herzegovina |
| Minimum | $2,499 | $33,044 |
| Maximum | $72,836 | $59,938 |
| Range | $70,337 | $26,894 |
| Mean | $48,668 | $43,428 |
| Median | $48,062 | $44,487 |
| Interquartile 25% (IQ1) | $41,953 | $39,026 |
| Interquartile 75% (IQ3) | $54,537 | $47,127 |
| Interquartile Range (IQR) | $12,584 | $8,100 |
| Standard Deviation (Sample) | $12,230 | $5,836 |
| Standard Deviation (Population) | $12,110 | $5,763 |
Similar Demographics by Median Earnings
Demographics Similar to Zimbabweans by Median Earnings
In terms of median earnings, the demographic groups most similar to Zimbabweans are Lebanese ($48,226, a difference of 0.010%), Pakistani ($48,254, a difference of 0.050%), Immigrants from Philippines ($48,266, a difference of 0.080%), British ($48,189, a difference of 0.080%), and Sierra Leonean ($48,286, a difference of 0.12%).
| Demographics | Rating | Rank | Median Earnings |
| Immigrants | Syria | 93.9 /100 | #123 | Exceptional $48,375 |
| Brazilians | 93.7 /100 | #124 | Exceptional $48,356 |
| Immigrants | Fiji | 93.3 /100 | #125 | Exceptional $48,305 |
| Assyrians/Chaldeans/Syriacs | 93.3 /100 | #126 | Exceptional $48,304 |
| Sierra Leoneans | 93.1 /100 | #127 | Exceptional $48,286 |
| Immigrants | Philippines | 92.9 /100 | #128 | Exceptional $48,266 |
| Pakistanis | 92.8 /100 | #129 | Exceptional $48,254 |
| Zimbabweans | 92.6 /100 | #130 | Exceptional $48,229 |
| Lebanese | 92.5 /100 | #131 | Exceptional $48,226 |
| British | 92.2 /100 | #132 | Exceptional $48,189 |
| Immigrants | Uganda | 90.5 /100 | #133 | Exceptional $48,041 |
| Sri Lankans | 90.5 /100 | #134 | Exceptional $48,040 |
| Portuguese | 90.4 /100 | #135 | Exceptional $48,032 |
| Slovenes | 90.0 /100 | #136 | Excellent $47,995 |
| Immigrants | Nepal | 89.0 /100 | #137 | Excellent $47,925 |
Demographics Similar to Immigrants from Bosnia and Herzegovina by Median Earnings
In terms of median earnings, the demographic groups most similar to Immigrants from Bosnia and Herzegovina are Immigrants from Thailand ($45,598, a difference of 0.0%), Immigrants from Grenada ($45,596, a difference of 0.010%), Panamanian ($45,593, a difference of 0.010%), Bermudan ($45,593, a difference of 0.010%), and Immigrants from Senegal ($45,611, a difference of 0.020%).
| Demographics | Rating | Rank | Median Earnings |
| Celtics | 27.2 /100 | #201 | Fair $45,732 |
| Immigrants | Trinidad and Tobago | 27.1 /100 | #202 | Fair $45,729 |
| Welsh | 26.6 /100 | #203 | Fair $45,710 |
| Immigrants | Uruguay | 25.9 /100 | #204 | Fair $45,682 |
| Tongans | 25.4 /100 | #205 | Fair $45,665 |
| Immigrants | Ghana | 24.8 /100 | #206 | Fair $45,641 |
| Immigrants | Senegal | 24.0 /100 | #207 | Fair $45,611 |
| Immigrants | Bosnia and Herzegovina | 23.7 /100 | #208 | Fair $45,600 |
| Immigrants | Thailand | 23.7 /100 | #209 | Fair $45,598 |
| Immigrants | Grenada | 23.6 /100 | #210 | Fair $45,596 |
| Panamanians | 23.5 /100 | #211 | Fair $45,593 |
| Bermudans | 23.5 /100 | #212 | Fair $45,593 |
| Immigrants | Colombia | 22.4 /100 | #213 | Fair $45,550 |
| Nigerians | 22.0 /100 | #214 | Fair $45,532 |
| Immigrants | Bangladesh | 22.0 /100 | #215 | Fair $45,532 |