Zimbabwean vs Australian Householder Income Under 25 years
COMPARE
Zimbabwean
Australian
Householder Income Under 25 years
Householder Income Under 25 years Comparison
Zimbabweans
Australians
$51,259
HOUSEHOLDER INCOME UNDER 25 YEARS
9.3/ 100
METRIC RATING
214th/ 347
METRIC RANK
$53,739
HOUSEHOLDER INCOME UNDER 25 YEARS
97.8/ 100
METRIC RATING
107th/ 347
METRIC RANK
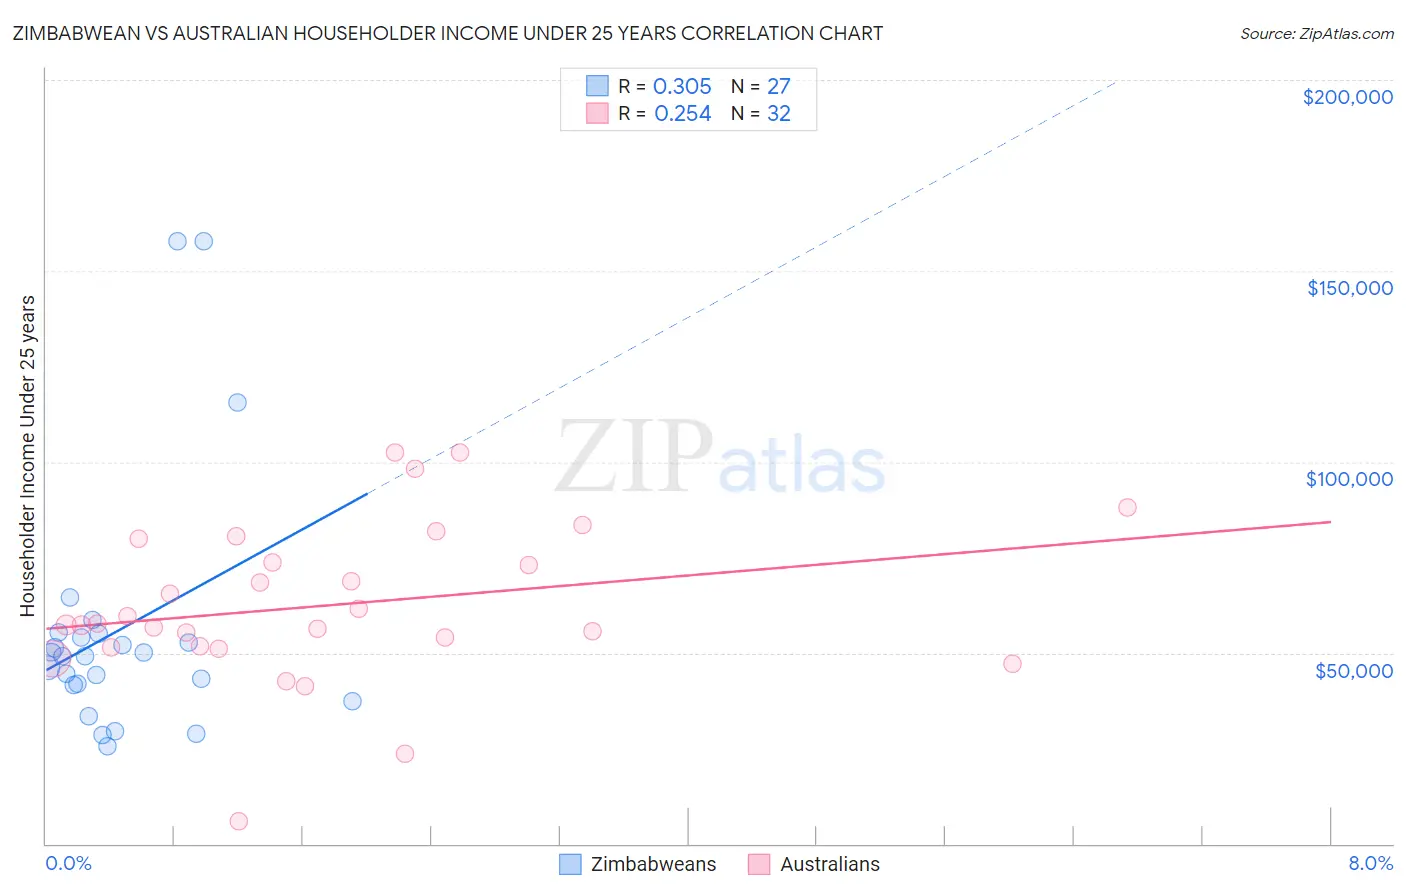
Zimbabwean vs Australian Householder Income Under 25 years Correlation Chart
The statistical analysis conducted on geographies consisting of 66,344,715 people shows a mild positive correlation between the proportion of Zimbabweans and household income with householder under the age of 25 in the United States with a correlation coefficient (R) of 0.305 and weighted average of $51,259. Similarly, the statistical analysis conducted on geographies consisting of 200,158,480 people shows a weak positive correlation between the proportion of Australians and household income with householder under the age of 25 in the United States with a correlation coefficient (R) of 0.254 and weighted average of $53,739, a difference of 4.8%.
Householder Income Under 25 years Correlation Summary
| Measurement | Zimbabwean | Australian |
| Minimum | $25,388 | $6,009 |
| Maximum | $157,810 | $102,500 |
| Range | $132,422 | $96,491 |
| Mean | $56,178 | $62,514 |
| Median | $48,971 | $57,436 |
| Interquartile 25% (IQ1) | $41,511 | $51,485 |
| Interquartile 75% (IQ3) | $55,000 | $76,760 |
| Interquartile Range (IQR) | $13,489 | $25,275 |
| Standard Deviation (Sample) | $33,671 | $20,939 |
| Standard Deviation (Population) | $33,042 | $20,609 |
Similar Demographics by Householder Income Under 25 years
Demographics Similar to Zimbabweans by Householder Income Under 25 years
In terms of householder income under 25 years, the demographic groups most similar to Zimbabweans are Dutch ($51,265, a difference of 0.010%), Icelander ($51,247, a difference of 0.020%), Immigrants from Panama ($51,278, a difference of 0.040%), French ($51,230, a difference of 0.060%), and Czechoslovakian ($51,224, a difference of 0.070%).
| Demographics | Rating | Rank | Householder Income Under 25 years |
| South Africans | 12.2 /100 | #207 | Poor $51,383 |
| Immigrants | Jordan | 11.9 /100 | #208 | Poor $51,370 |
| Syrians | 11.4 /100 | #209 | Poor $51,353 |
| Immigrants | Ghana | 10.9 /100 | #210 | Poor $51,333 |
| Irish | 10.6 /100 | #211 | Poor $51,317 |
| Immigrants | Panama | 9.7 /100 | #212 | Tragic $51,278 |
| Dutch | 9.4 /100 | #213 | Tragic $51,265 |
| Zimbabweans | 9.3 /100 | #214 | Tragic $51,259 |
| Icelanders | 9.1 /100 | #215 | Tragic $51,247 |
| French | 8.7 /100 | #216 | Tragic $51,230 |
| Czechoslovakians | 8.6 /100 | #217 | Tragic $51,224 |
| Immigrants | Belize | 8.6 /100 | #218 | Tragic $51,223 |
| Arabs | 8.5 /100 | #219 | Tragic $51,219 |
| Immigrants | Germany | 8.0 /100 | #220 | Tragic $51,190 |
| Immigrants | Eastern Africa | 7.4 /100 | #221 | Tragic $51,158 |
Demographics Similar to Australians by Householder Income Under 25 years
In terms of householder income under 25 years, the demographic groups most similar to Australians are Maltese ($53,735, a difference of 0.010%), Immigrants from Ecuador ($53,722, a difference of 0.030%), Greek ($53,715, a difference of 0.040%), Immigrants from Colombia ($53,714, a difference of 0.050%), and Albanian ($53,794, a difference of 0.10%).
| Demographics | Rating | Rank | Householder Income Under 25 years |
| Immigrants | Kazakhstan | 98.8 /100 | #100 | Exceptional $53,990 |
| South Americans | 98.6 /100 | #101 | Exceptional $53,939 |
| Ecuadorians | 98.5 /100 | #102 | Exceptional $53,911 |
| Ukrainians | 98.3 /100 | #103 | Exceptional $53,843 |
| Ethiopians | 98.2 /100 | #104 | Exceptional $53,818 |
| Immigrants | France | 98.1 /100 | #105 | Exceptional $53,805 |
| Albanians | 98.1 /100 | #106 | Exceptional $53,794 |
| Australians | 97.8 /100 | #107 | Exceptional $53,739 |
| Maltese | 97.8 /100 | #108 | Exceptional $53,735 |
| Immigrants | Ecuador | 97.7 /100 | #109 | Exceptional $53,722 |
| Greeks | 97.7 /100 | #110 | Exceptional $53,715 |
| Immigrants | Colombia | 97.7 /100 | #111 | Exceptional $53,714 |
| Immigrants | Oceania | 97.5 /100 | #112 | Exceptional $53,680 |
| Romanians | 97.2 /100 | #113 | Exceptional $53,632 |
| Immigrants | Sweden | 97.1 /100 | #114 | Exceptional $53,621 |