Yup'ik vs French American Indian Median Household Income
COMPARE
Yup'ik
French American Indian
Median Household Income
Median Household Income Comparison
Yup'ik
French American Indians
$69,695
MEDIAN HOUSEHOLD INCOME
0.0/ 100
METRIC RATING
324th/ 347
METRIC RANK
$76,387
MEDIAN HOUSEHOLD INCOME
0.4/ 100
METRIC RATING
262nd/ 347
METRIC RANK
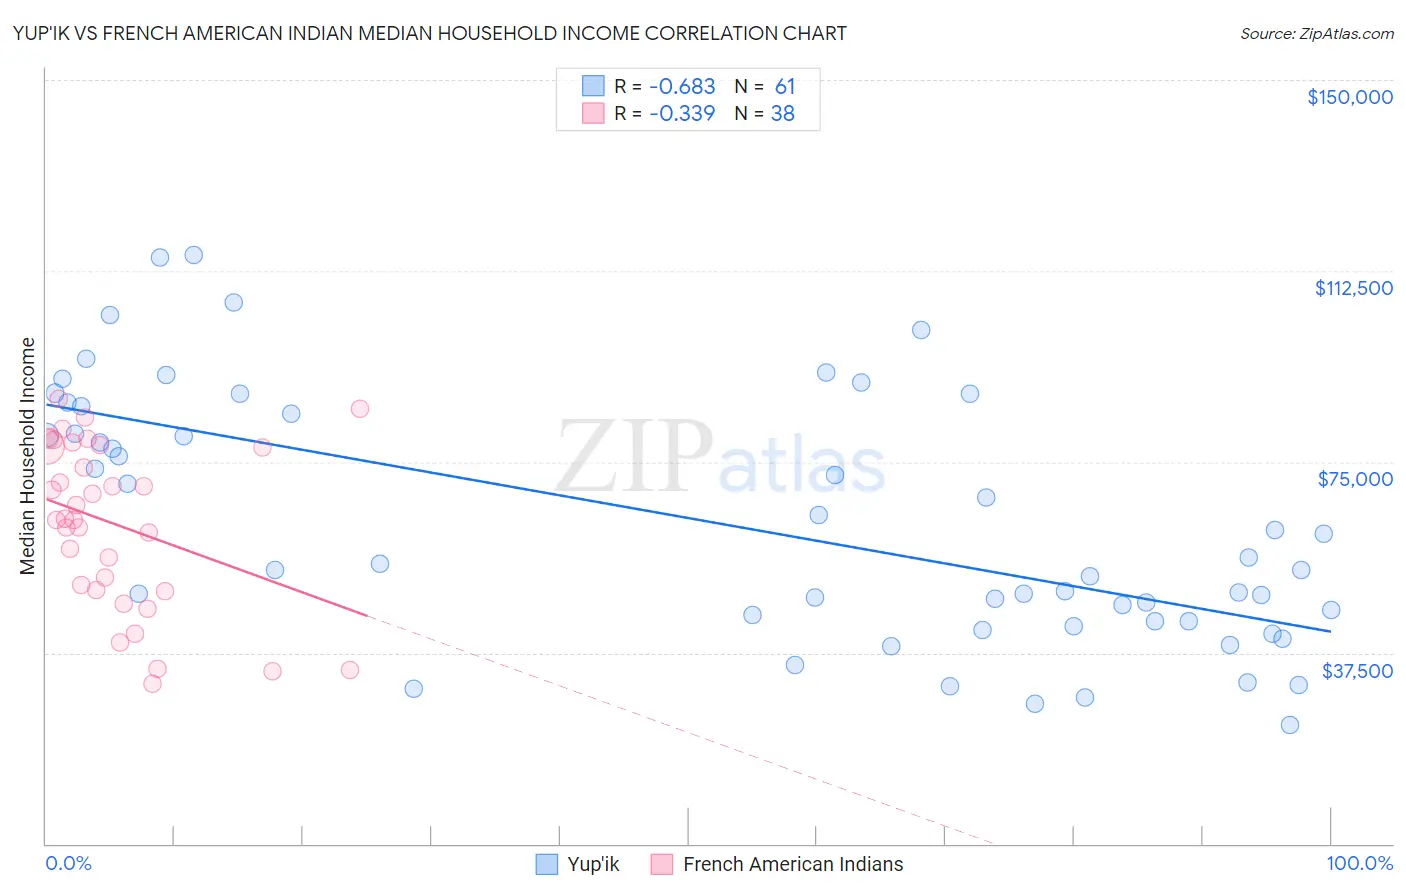
Yup'ik vs French American Indian Median Household Income Correlation Chart
The statistical analysis conducted on geographies consisting of 39,952,449 people shows a significant negative correlation between the proportion of Yup'ik and median household income in the United States with a correlation coefficient (R) of -0.683 and weighted average of $69,695. Similarly, the statistical analysis conducted on geographies consisting of 131,952,383 people shows a mild negative correlation between the proportion of French American Indians and median household income in the United States with a correlation coefficient (R) of -0.339 and weighted average of $76,387, a difference of 9.6%.
Median Household Income Correlation Summary
| Measurement | Yup'ik | French American Indian |
| Minimum | $23,333 | $31,325 |
| Maximum | $115,625 | $87,295 |
| Range | $92,292 | $55,970 |
| Mean | $62,948 | $62,652 |
| Median | $55,000 | $63,795 |
| Interquartile 25% (IQ1) | $43,673 | $49,785 |
| Interquartile 75% (IQ3) | $85,198 | $78,132 |
| Interquartile Range (IQR) | $41,525 | $28,346 |
| Standard Deviation (Sample) | $24,365 | $16,205 |
| Standard Deviation (Population) | $24,165 | $15,990 |
Similar Demographics by Median Household Income
Demographics Similar to Yup'ik by Median Household Income
In terms of median household income, the demographic groups most similar to Yup'ik are Bahamian ($69,726, a difference of 0.040%), Choctaw ($69,947, a difference of 0.36%), Seminole ($69,420, a difference of 0.40%), Chickasaw ($70,005, a difference of 0.45%), and Colville ($70,094, a difference of 0.57%).
| Demographics | Rating | Rank | Median Household Income |
| Cajuns | 0.0 /100 | #317 | Tragic $70,605 |
| Chippewa | 0.0 /100 | #318 | Tragic $70,539 |
| Immigrants | Dominican Republic | 0.0 /100 | #319 | Tragic $70,208 |
| Colville | 0.0 /100 | #320 | Tragic $70,094 |
| Chickasaw | 0.0 /100 | #321 | Tragic $70,005 |
| Choctaw | 0.0 /100 | #322 | Tragic $69,947 |
| Bahamians | 0.0 /100 | #323 | Tragic $69,726 |
| Yup'ik | 0.0 /100 | #324 | Tragic $69,695 |
| Seminole | 0.0 /100 | #325 | Tragic $69,420 |
| Yuman | 0.0 /100 | #326 | Tragic $68,743 |
| Immigrants | Cuba | 0.0 /100 | #327 | Tragic $68,461 |
| Menominee | 0.0 /100 | #328 | Tragic $68,423 |
| Dutch West Indians | 0.0 /100 | #329 | Tragic $68,412 |
| Arapaho | 0.0 /100 | #330 | Tragic $67,965 |
| Natives/Alaskans | 0.0 /100 | #331 | Tragic $67,879 |
Demographics Similar to French American Indians by Median Household Income
In terms of median household income, the demographic groups most similar to French American Indians are Alaskan Athabascan ($76,383, a difference of 0.010%), Immigrants from Grenada ($76,517, a difference of 0.17%), Jamaican ($76,583, a difference of 0.26%), Spanish American Indian ($76,670, a difference of 0.37%), and Immigrants from Nicaragua ($76,784, a difference of 0.52%).
| Demographics | Rating | Rank | Median Household Income |
| Immigrants | Middle Africa | 0.8 /100 | #255 | Tragic $77,559 |
| Belizeans | 0.6 /100 | #256 | Tragic $77,028 |
| Immigrants | Senegal | 0.5 /100 | #257 | Tragic $76,915 |
| Immigrants | Nicaragua | 0.5 /100 | #258 | Tragic $76,784 |
| Spanish American Indians | 0.4 /100 | #259 | Tragic $76,670 |
| Jamaicans | 0.4 /100 | #260 | Tragic $76,583 |
| Immigrants | Grenada | 0.4 /100 | #261 | Tragic $76,517 |
| French American Indians | 0.4 /100 | #262 | Tragic $76,387 |
| Alaskan Athabascans | 0.4 /100 | #263 | Tragic $76,383 |
| Guatemalans | 0.3 /100 | #264 | Tragic $75,961 |
| Immigrants | Belize | 0.3 /100 | #265 | Tragic $75,938 |
| Americans | 0.3 /100 | #266 | Tragic $75,932 |
| German Russians | 0.3 /100 | #267 | Tragic $75,856 |
| Immigrants | Jamaica | 0.3 /100 | #268 | Tragic $75,851 |
| Cape Verdeans | 0.3 /100 | #269 | Tragic $75,848 |