Yaqui vs Cheyenne Median Household Income
COMPARE
Yaqui
Cheyenne
Median Household Income
Median Household Income Comparison
Yaqui
Cheyenne
$74,596
MEDIAN HOUSEHOLD INCOME
0.1/ 100
METRIC RATING
284th/ 347
METRIC RANK
$66,974
MEDIAN HOUSEHOLD INCOME
0.0/ 100
METRIC RATING
335th/ 347
METRIC RANK
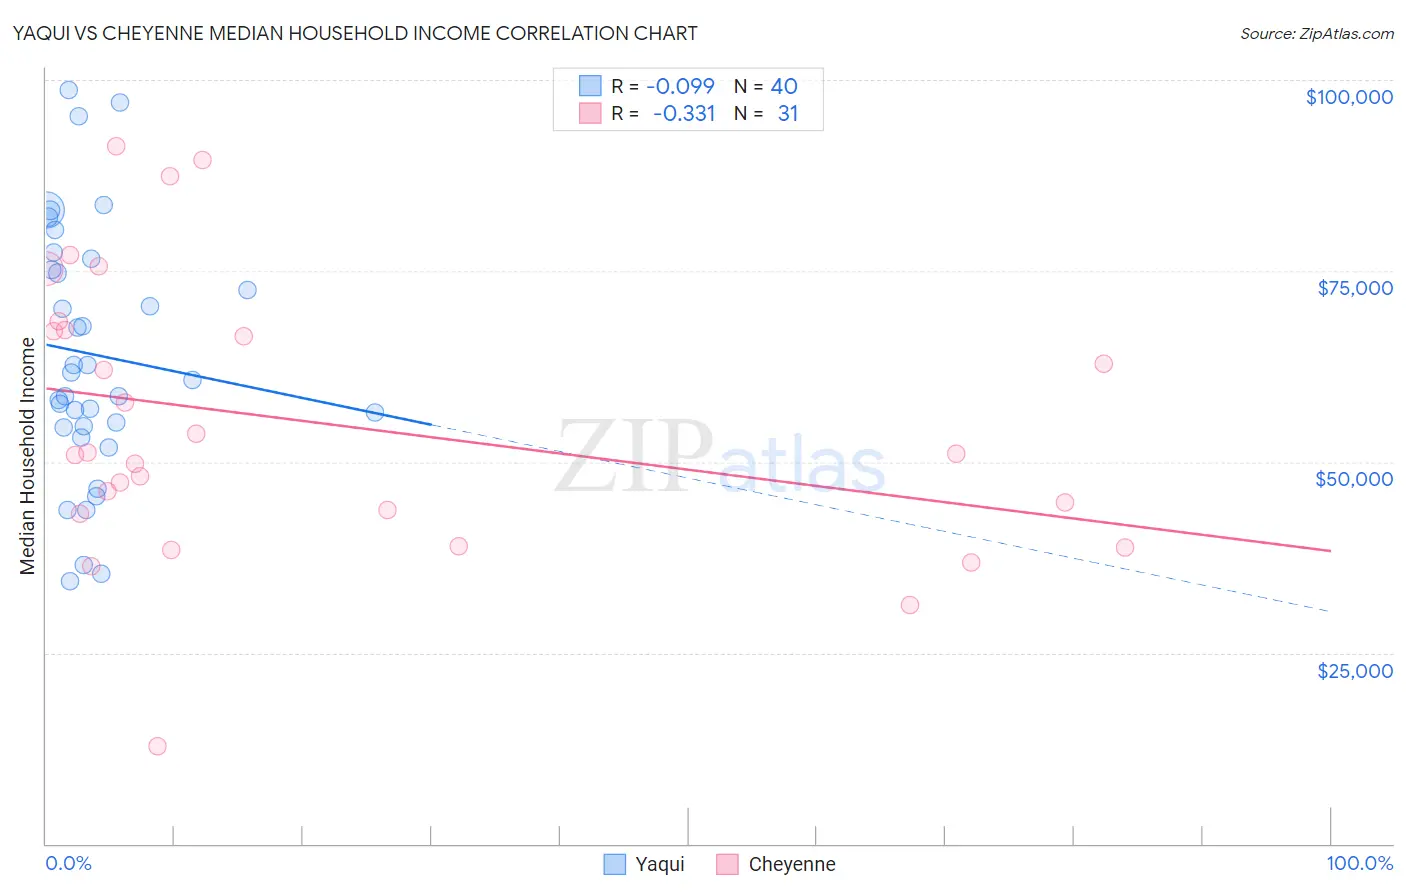
Yaqui vs Cheyenne Median Household Income Correlation Chart
The statistical analysis conducted on geographies consisting of 107,719,305 people shows a slight negative correlation between the proportion of Yaqui and median household income in the United States with a correlation coefficient (R) of -0.099 and weighted average of $74,596. Similarly, the statistical analysis conducted on geographies consisting of 80,700,473 people shows a mild negative correlation between the proportion of Cheyenne and median household income in the United States with a correlation coefficient (R) of -0.331 and weighted average of $66,974, a difference of 11.4%.
Median Household Income Correlation Summary
| Measurement | Yaqui | Cheyenne |
| Minimum | $34,415 | $12,708 |
| Maximum | $98,754 | $91,250 |
| Range | $64,339 | $78,542 |
| Mean | $64,033 | $55,202 |
| Median | $61,231 | $51,125 |
| Interquartile 25% (IQ1) | $54,573 | $43,228 |
| Interquartile 75% (IQ3) | $75,863 | $67,262 |
| Interquartile Range (IQR) | $21,290 | $24,034 |
| Standard Deviation (Sample) | $16,401 | $18,300 |
| Standard Deviation (Population) | $16,195 | $18,003 |
Similar Demographics by Median Household Income
Demographics Similar to Yaqui by Median Household Income
In terms of median household income, the demographic groups most similar to Yaqui are Cree ($74,685, a difference of 0.12%), Mexican ($74,399, a difference of 0.26%), Central American Indian ($74,847, a difference of 0.34%), Immigrants from Liberia ($74,896, a difference of 0.40%), and Immigrants from Somalia ($74,300, a difference of 0.40%).
| Demographics | Rating | Rank | Median Household Income |
| Spanish Americans | 0.2 /100 | #277 | Tragic $75,386 |
| Osage | 0.2 /100 | #278 | Tragic $75,240 |
| Immigrants | Guatemala | 0.2 /100 | #279 | Tragic $75,123 |
| Senegalese | 0.2 /100 | #280 | Tragic $74,999 |
| Immigrants | Liberia | 0.1 /100 | #281 | Tragic $74,896 |
| Central American Indians | 0.1 /100 | #282 | Tragic $74,847 |
| Cree | 0.1 /100 | #283 | Tragic $74,685 |
| Yaqui | 0.1 /100 | #284 | Tragic $74,596 |
| Mexicans | 0.1 /100 | #285 | Tragic $74,399 |
| Immigrants | Somalia | 0.1 /100 | #286 | Tragic $74,300 |
| Iroquois | 0.1 /100 | #287 | Tragic $74,279 |
| Immigrants | Central America | 0.1 /100 | #288 | Tragic $74,217 |
| Fijians | 0.1 /100 | #289 | Tragic $74,205 |
| Bangladeshis | 0.1 /100 | #290 | Tragic $74,112 |
| Hispanics or Latinos | 0.1 /100 | #291 | Tragic $73,823 |
Demographics Similar to Cheyenne by Median Household Income
In terms of median household income, the demographic groups most similar to Cheyenne are Immigrants from Congo ($66,768, a difference of 0.31%), Black/African American ($67,573, a difference of 0.89%), Creek ($67,715, a difference of 1.1%), Sioux ($67,792, a difference of 1.2%), and Native/Alaskan ($67,879, a difference of 1.3%).
| Demographics | Rating | Rank | Median Household Income |
| Menominee | 0.0 /100 | #328 | Tragic $68,423 |
| Dutch West Indians | 0.0 /100 | #329 | Tragic $68,412 |
| Arapaho | 0.0 /100 | #330 | Tragic $67,965 |
| Natives/Alaskans | 0.0 /100 | #331 | Tragic $67,879 |
| Sioux | 0.0 /100 | #332 | Tragic $67,792 |
| Creek | 0.0 /100 | #333 | Tragic $67,715 |
| Blacks/African Americans | 0.0 /100 | #334 | Tragic $67,573 |
| Cheyenne | 0.0 /100 | #335 | Tragic $66,974 |
| Immigrants | Congo | 0.0 /100 | #336 | Tragic $66,768 |
| Kiowa | 0.0 /100 | #337 | Tragic $65,914 |
| Immigrants | Yemen | 0.0 /100 | #338 | Tragic $65,194 |
| Hopi | 0.0 /100 | #339 | Tragic $65,043 |
| Pueblo | 0.0 /100 | #340 | Tragic $64,692 |
| Crow | 0.0 /100 | #341 | Tragic $63,681 |
| Pima | 0.0 /100 | #342 | Tragic $63,262 |