Yakama vs French American Indian Median Earnings
COMPARE
Yakama
French American Indian
Median Earnings
Median Earnings Comparison
Yakama
French American Indians
$39,107
MEDIAN EARNINGS
0.0/ 100
METRIC RATING
332nd/ 347
METRIC RANK
$43,333
MEDIAN EARNINGS
1.3/ 100
METRIC RATING
258th/ 347
METRIC RANK
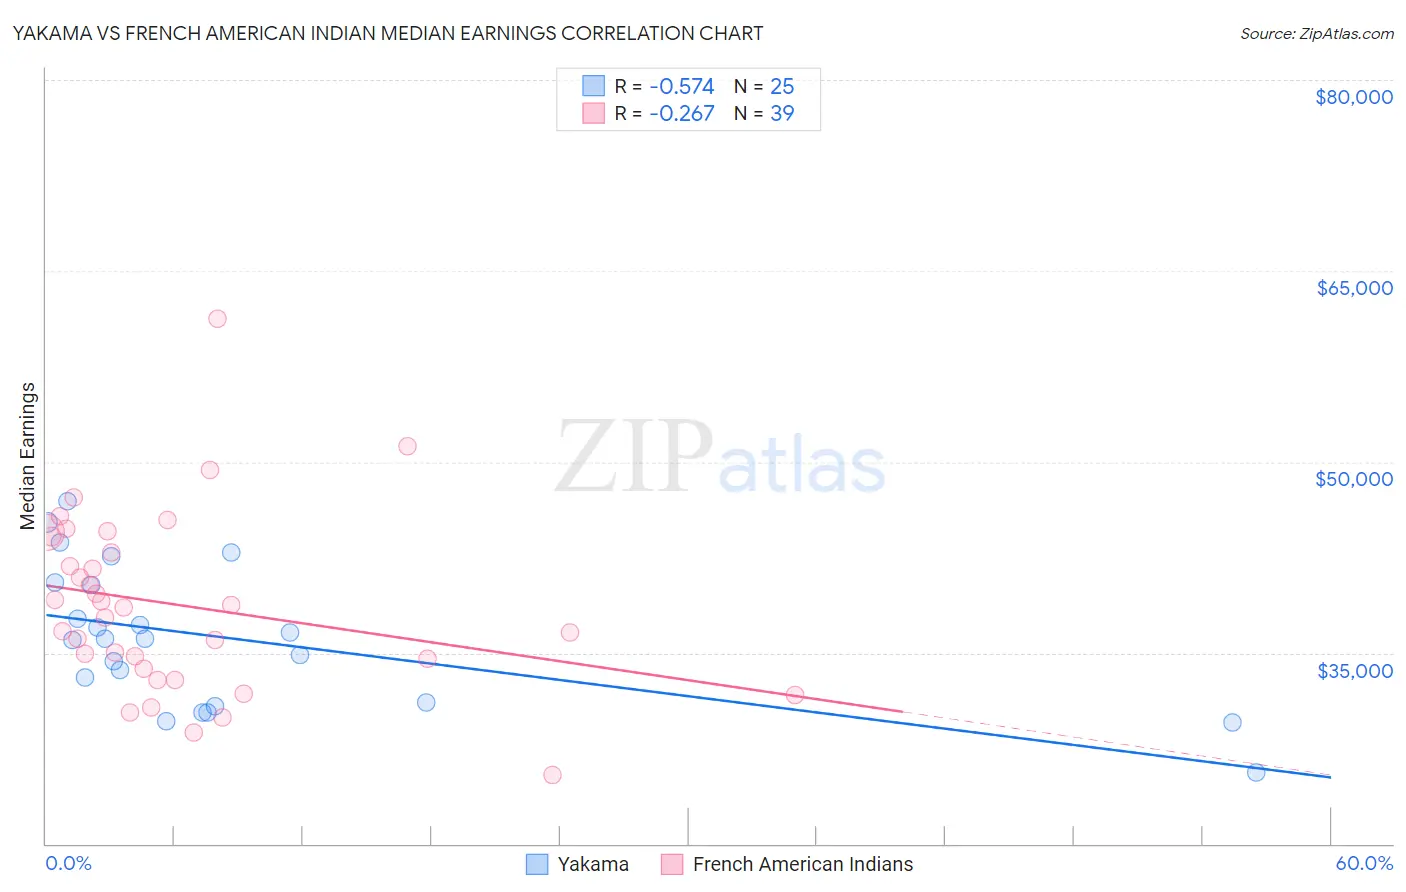
Yakama vs French American Indian Median Earnings Correlation Chart
The statistical analysis conducted on geographies consisting of 19,920,783 people shows a substantial negative correlation between the proportion of Yakama and median earnings in the United States with a correlation coefficient (R) of -0.574 and weighted average of $39,107. Similarly, the statistical analysis conducted on geographies consisting of 131,971,536 people shows a weak negative correlation between the proportion of French American Indians and median earnings in the United States with a correlation coefficient (R) of -0.267 and weighted average of $43,333, a difference of 10.8%.
Median Earnings Correlation Summary
| Measurement | Yakama | French American Indian |
| Minimum | $25,625 | $25,417 |
| Maximum | $46,951 | $61,250 |
| Range | $21,326 | $35,833 |
| Mean | $36,082 | $38,746 |
| Median | $36,058 | $38,517 |
| Interquartile 25% (IQ1) | $30,946 | $33,745 |
| Interquartile 75% (IQ3) | $40,418 | $44,112 |
| Interquartile Range (IQR) | $9,471 | $10,368 |
| Standard Deviation (Sample) | $5,481 | $7,041 |
| Standard Deviation (Population) | $5,370 | $6,950 |
Similar Demographics by Median Earnings
Demographics Similar to Yakama by Median Earnings
In terms of median earnings, the demographic groups most similar to Yakama are Immigrants from Mexico ($39,114, a difference of 0.020%), Immigrants from Congo ($39,169, a difference of 0.16%), Kiowa ($39,232, a difference of 0.32%), Houma ($38,949, a difference of 0.41%), and Spanish American Indian ($38,907, a difference of 0.52%).
| Demographics | Rating | Rank | Median Earnings |
| Creek | 0.0 /100 | #325 | Tragic $39,648 |
| Immigrants | Yemen | 0.0 /100 | #326 | Tragic $39,540 |
| Yuman | 0.0 /100 | #327 | Tragic $39,523 |
| Sioux | 0.0 /100 | #328 | Tragic $39,448 |
| Kiowa | 0.0 /100 | #329 | Tragic $39,232 |
| Immigrants | Congo | 0.0 /100 | #330 | Tragic $39,169 |
| Immigrants | Mexico | 0.0 /100 | #331 | Tragic $39,114 |
| Yakama | 0.0 /100 | #332 | Tragic $39,107 |
| Houma | 0.0 /100 | #333 | Tragic $38,949 |
| Spanish American Indians | 0.0 /100 | #334 | Tragic $38,907 |
| Natives/Alaskans | 0.0 /100 | #335 | Tragic $38,896 |
| Crow | 0.0 /100 | #336 | Tragic $38,707 |
| Immigrants | Cuba | 0.0 /100 | #337 | Tragic $38,426 |
| Pima | 0.0 /100 | #338 | Tragic $38,285 |
| Menominee | 0.0 /100 | #339 | Tragic $37,884 |
Demographics Similar to French American Indians by Median Earnings
In terms of median earnings, the demographic groups most similar to French American Indians are Jamaican ($43,343, a difference of 0.020%), Alaskan Athabascan ($43,393, a difference of 0.14%), Immigrants from Middle Africa ($43,416, a difference of 0.19%), German Russian ($43,200, a difference of 0.31%), and Liberian ($43,536, a difference of 0.47%).
| Demographics | Rating | Rank | Median Earnings |
| Tsimshian | 2.1 /100 | #251 | Tragic $43,695 |
| Hawaiians | 2.0 /100 | #252 | Tragic $43,673 |
| Somalis | 1.8 /100 | #253 | Tragic $43,567 |
| Liberians | 1.7 /100 | #254 | Tragic $43,536 |
| Immigrants | Middle Africa | 1.4 /100 | #255 | Tragic $43,416 |
| Alaskan Athabascans | 1.4 /100 | #256 | Tragic $43,393 |
| Jamaicans | 1.3 /100 | #257 | Tragic $43,343 |
| French American Indians | 1.3 /100 | #258 | Tragic $43,333 |
| German Russians | 1.1 /100 | #259 | Tragic $43,200 |
| Immigrants | Somalia | 0.9 /100 | #260 | Tragic $43,100 |
| Immigrants | Jamaica | 0.8 /100 | #261 | Tragic $43,026 |
| Nicaraguans | 0.8 /100 | #262 | Tragic $43,026 |
| Inupiat | 0.8 /100 | #263 | Tragic $43,000 |
| Immigrants | Liberia | 0.7 /100 | #264 | Tragic $42,923 |
| Salvadorans | 0.7 /100 | #265 | Tragic $42,912 |