Welsh vs Native Hawaiian Median Family Income

COMPARE

Welsh
Race
Ancestry
AfghanAfricanAlaska NativeAlaskan AthabascanAlbanianAleutAlsatianAmericanApacheArabArapahoArgentineanArmenianAssyrian/Chaldean/SyriacAustralianAustrianBahamianBangladeshiBarbadianBasqueBelgianBelizeanBermudanBhutaneseBlackfeetBolivianBrazilianBritishBritish West IndianBulgarianBurmeseCajunCambodianCanadianCape VerdeanCarpatho RusynCelticCentral AmericanCentral American IndianCherokeeCheyenneChickasawChileanChineseChippewaChoctawColombianColvilleComancheCosta RicanCreeCreekCroatianCrowCubanCypriotCzechCzechoslovakianDanishDelawareDominicanDutchDutch West IndianEastern EuropeanEcuadorianEgyptianEnglishEstonianEthiopianEuropeanFijianFilipinoFinnishFrenchFrench American IndianFrench CanadianGermanGerman RussianGhanaianGreekGuamanian/ChamorroGuatemalanGuyaneseHaitianHmongHonduranHopiHoumaHungarianIcelanderIndian (Asian)IndonesianInupiatIranianIraqiIrishIroquoisIsraeliItalianJamaicanJapaneseJordanianKenyanKiowaKoreanLaotianLatvianLebaneseLiberianLithuanianLumbeeLuxembourgerMacedonianMalaysianMalteseMarshalleseMenomineeMexicanMexican American IndianMongolianMoroccanNavajoNepaleseNew ZealanderNicaraguanNigerianNorthern EuropeanNorwegianOkinawanOsageOttawaPaiutePakistaniPalestinianPanamanianParaguayanPennsylvania GermanPeruvianPimaPolishPortuguesePotawatomiPuebloPuerto RicanPuget Sound SalishRomanianRussianSalvadoranSamoanScandinavianScotch-IrishScottishSeminoleSenegaleseSerbianShoshoneSierra LeoneanSiouxSlavicSlovakSloveneSomaliSouth AfricanSouth AmericanSouth American IndianSoviet UnionSpaniardSpanishSpanish AmericanSpanish American IndianSri LankanSubsaharan AfricanSudaneseSwedishSwissSyrianTaiwaneseThaiTlingit-HaidaTohono O'OdhamTonganTrinidadian and TobagonianTsimshianTurkishU.S. Virgin IslanderUgandanUkrainianUruguayanUteVenezuelanVietnameseWelshWest IndianYakamaYaquiYugoslavianYumanYup'ikZimbabwean
Immigration
NonimmigrantsImmigrantsAfghanistanAfricaAlbaniaArgentinaArmeniaAsiaAustraliaAustriaBahamasBangladeshBarbadosBelarusBelgiumBelizeBoliviaBosnia and HerzegovinaBrazilBulgariaBurma/MyanmarCabo VerdeCambodiaCameroonCanadaCaribbeanCentral AmericaChileChinaColombiaCongoCosta RicaCroatiaCubaCzechoslovakiaDenmarkDominicaDominican RepublicEastern AfricaEastern AsiaEastern EuropeEcuadorEgyptEl SalvadorEnglandEritreaEthiopiaEuropeFijiFranceGermanyGhanaGreeceGrenadaGuatemalaGuyanaHaitiHondurasHong KongHungaryIndiaIndonesiaIranIraqIrelandIsraelItalyJamaicaJapanJordanKazakhstanKenyaKoreaKuwaitLaosLatin AmericaLatviaLebanonLiberiaLithuaniaMalaysiaMexicoMicronesiaMiddle AfricaMoldovaMoroccoNepalNetherlandsNicaraguaNigeriaNorth AmericaNorth MacedoniaNorthern AfricaNorthern EuropeNorwayOceaniaPakistanPanamaPeruPhilippinesPolandPortugalRomaniaRussiaSaudi ArabiaScotlandSenegalSerbiaSierra LeoneSingaporeSomaliaSouth AfricaSouth AmericaSouth Central AsiaSouth Eastern AsiaSouthern EuropeSpainSri LankaSt. Vincent and the GrenadinesSudanSwedenSwitzerlandSyriaTaiwanThailandTrinidad and TobagoTurkeyUgandaUkraineUruguayUzbekistanVenezuelaVietnamWest IndiesWestern AfricaWestern AsiaWestern EuropeYemenZaireZimbabweAzores
Native Hawaiian
Race
Ancestry
AfghanAfricanAlaska NativeAlaskan AthabascanAlbanianAleutAlsatianAmericanApacheArabArapahoArgentineanArmenianAssyrian/Chaldean/SyriacAustralianAustrianBahamianBangladeshiBarbadianBasqueBelgianBelizeanBermudanBhutaneseBlackfeetBolivianBrazilianBritishBritish West IndianBulgarianBurmeseCajunCambodianCanadianCape VerdeanCarpatho RusynCelticCentral AmericanCentral American IndianCherokeeCheyenneChickasawChileanChineseChippewaChoctawColombianColvilleComancheCosta RicanCreeCreekCroatianCrowCubanCypriotCzechCzechoslovakianDanishDelawareDominicanDutchDutch West IndianEastern EuropeanEcuadorianEgyptianEnglishEstonianEthiopianEuropeanFijianFilipinoFinnishFrenchFrench American IndianFrench CanadianGermanGerman RussianGhanaianGreekGuamanian/ChamorroGuatemalanGuyaneseHaitianHmongHonduranHopiHoumaHungarianIcelanderIndian (Asian)IndonesianInupiatIranianIraqiIrishIroquoisIsraeliItalianJamaicanJapaneseJordanianKenyanKiowaKoreanLaotianLatvianLebaneseLiberianLithuanianLumbeeLuxembourgerMacedonianMalaysianMalteseMarshalleseMenomineeMexicanMexican American IndianMongolianMoroccanNative HawaiianNavajoNepaleseNew ZealanderNicaraguanNigerianNorthern EuropeanNorwegianOkinawanOsageOttawaPaiutePakistaniPalestinianPanamanianParaguayanPennsylvania GermanPeruvianPimaPolishPortuguesePotawatomiPuebloPuerto RicanPuget Sound SalishRomanianRussianSalvadoranSamoanScandinavianScotch-IrishScottishSeminoleSenegaleseSerbianShoshoneSierra LeoneanSiouxSlavicSlovakSloveneSomaliSouth AfricanSouth AmericanSouth American IndianSoviet UnionSpaniardSpanishSpanish AmericanSpanish American IndianSri LankanSubsaharan AfricanSudaneseSwedishSwissSyrianTaiwaneseThaiTlingit-HaidaTohono O'OdhamTonganTrinidadian and TobagonianTsimshianTurkishU.S. Virgin IslanderUgandanUkrainianUruguayanUteVenezuelanVietnameseWest IndianYakamaYaquiYugoslavianYumanYup'ikZimbabwean
Immigration
NonimmigrantsImmigrantsAfghanistanAfricaAlbaniaArgentinaArmeniaAsiaAustraliaAustriaBahamasBangladeshBarbadosBelarusBelgiumBelizeBoliviaBosnia and HerzegovinaBrazilBulgariaBurma/MyanmarCabo VerdeCambodiaCameroonCanadaCaribbeanCentral AmericaChileChinaColombiaCongoCosta RicaCroatiaCubaCzechoslovakiaDenmarkDominicaDominican RepublicEastern AfricaEastern AsiaEastern EuropeEcuadorEgyptEl SalvadorEnglandEritreaEthiopiaEuropeFijiFranceGermanyGhanaGreeceGrenadaGuatemalaGuyanaHaitiHondurasHong KongHungaryIndiaIndonesiaIranIraqIrelandIsraelItalyJamaicaJapanJordanKazakhstanKenyaKoreaKuwaitLaosLatin AmericaLatviaLebanonLiberiaLithuaniaMalaysiaMexicoMicronesiaMiddle AfricaMoldovaMoroccoNepalNetherlandsNicaraguaNigeriaNorth AmericaNorth MacedoniaNorthern AfricaNorthern EuropeNorwayOceaniaPakistanPanamaPeruPhilippinesPolandPortugalRomaniaRussiaSaudi ArabiaScotlandSenegalSerbiaSierra LeoneSingaporeSomaliaSouth AfricaSouth AmericaSouth Central AsiaSouth Eastern AsiaSouthern EuropeSpainSri LankaSt. Vincent and the GrenadinesSudanSwedenSwitzerlandSyriaTaiwanThailandTrinidad and TobagoTurkeyUgandaUkraineUruguayUzbekistanVenezuelaVietnamWest IndiesWestern AfricaWestern AsiaWestern EuropeYemenZaireZimbabweAzores
Median Family Income
Income
Poverty
Unemployment
Labor Participation
Family Structure
Vehicle Availability
Education Level
Disability

Median Family Income Comparison

Welsh

Native Hawaiians

Average
Good
$102,151
MEDIAN FAMILY INCOME
43.3/ 100
METRIC RATING
178th/ 347
METRIC RANK
$104,910
MEDIAN FAMILY INCOME
75.8/ 100
METRIC RATING
155th/ 347
METRIC RANK

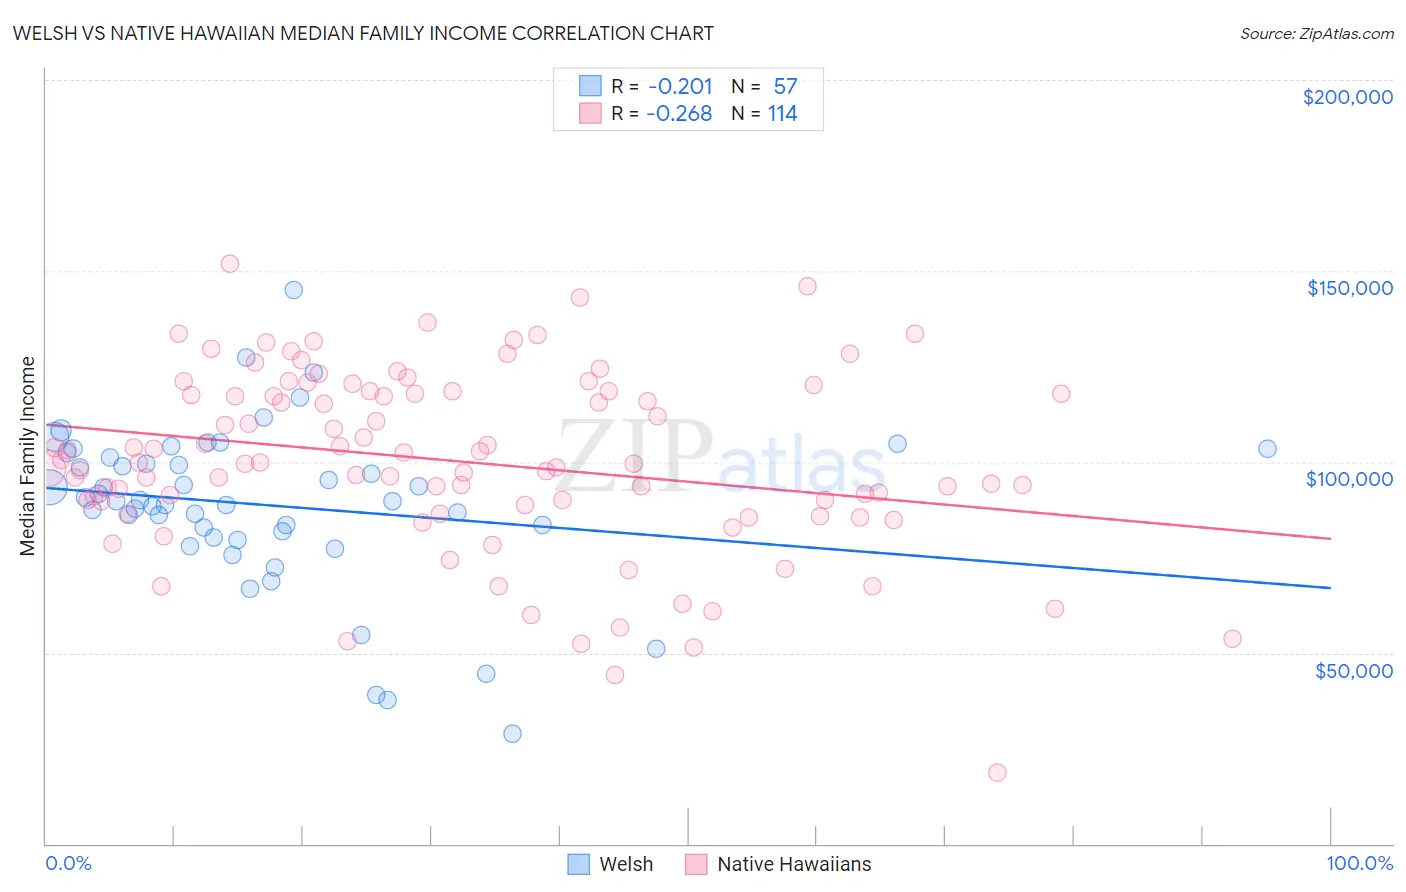
Welsh vs Native Hawaiian Median Family Income Correlation Chart

The statistical analysis conducted on geographies consisting of 527,824,493 people shows a weak negative correlation between the proportion of Welsh and median family income in the United States with a correlation coefficient (R) of -0.201 and weighted average of $102,151. Similarly, the statistical analysis conducted on geographies consisting of 331,783,011 people shows a weak negative correlation between the proportion of Native Hawaiians and median family income in the United States with a correlation coefficient (R) of -0.268 and weighted average of $104,910, a difference of 2.7%.
Welsh vs Native Hawaiian Median Family Income

Median Family Income Correlation Summary

MeasurementWelshNative Hawaiian
Minimum$28,750$18,796
Maximum$145,055$151,740
Range$116,305$132,944
Mean$88,686$100,179
Median$89,832$99,798
Interquartile 25% (IQ1)$80,992$88,761
Interquartile 75% (IQ3)$101,775$118,333
Interquartile Range (IQR)$20,783$29,572
Standard Deviation (Sample)$21,326$23,926
Standard Deviation (Population)$21,138$23,821

Similar Demographics by Median Family Income

Demographics Similar to Welsh by Median Family Income

In terms of median family income, the demographic groups most similar to Welsh are German ($102,254, a difference of 0.10%), French ($102,368, a difference of 0.21%), Immigrants from Eastern Africa ($102,451, a difference of 0.29%), South American ($101,856, a difference of 0.29%), and Finnish ($102,676, a difference of 0.51%).
DemographicsRating | RankMedian Family Income
Alsatians
54.3
/100
|
#171
Average
$103,010
Immigrants | Eritrea
51.9
/100
|
#172
Average
$102,823
Belgians
51.4
/100
|
#173
Average
$102,788
Finns
50.0
/100
|
#174
Average
$102,676
Immigrants | Eastern Africa
47.1
/100
|
#175
Average
$102,451
French
46.1
/100
|
#176
Average
$102,368
Germans
44.6
/100
|
#177
Average
$102,254
Welsh
43.3
/100
|
#178
Average
$102,151
South Americans
39.7
/100
|
#179
Fair
$101,856
French Canadians
37.0
/100
|
#180
Fair
$101,634
Spaniards
36.8
/100
|
#181
Fair
$101,617
Tsimshian
35.9
/100
|
#182
Fair
$101,543
Kenyans
34.5
/100
|
#183
Fair
$101,417
Immigrants | Costa Rica
33.7
/100
|
#184
Fair
$101,354
Dutch
31.9
/100
|
#185
Fair
$101,192

Demographics Similar to Native Hawaiians by Median Family Income

In terms of median family income, the demographic groups most similar to Native Hawaiians are Immigrants from Nepal ($104,966, a difference of 0.050%), Basque ($104,760, a difference of 0.14%), Slavic ($105,144, a difference of 0.22%), Immigrants from Albania ($105,285, a difference of 0.36%), and Moroccan ($104,488, a difference of 0.40%).
DemographicsRating | RankMedian Family Income
Hungarians
81.7
/100
|
#148
Excellent
$105,609
Immigrants | Germany
80.9
/100
|
#149
Excellent
$105,507
Irish
80.5
/100
|
#150
Excellent
$105,453
Peruvians
80.4
/100
|
#151
Excellent
$105,444
Immigrants | Albania
79.1
/100
|
#152
Good
$105,285
Slavs
77.9
/100
|
#153
Good
$105,144
Immigrants | Nepal
76.3
/100
|
#154
Good
$104,966
Native Hawaiians
75.8
/100
|
#155
Good
$104,910
Basques
74.4
/100
|
#156
Good
$104,760
Moroccans
71.6
/100
|
#157
Good
$104,488
Scandinavians
70.8
/100
|
#158
Good
$104,410
Swiss
70.7
/100
|
#159
Good
$104,396
Scottish
69.5
/100
|
#160
Good
$104,288
Icelanders
69.4
/100
|
#161
Good
$104,282
Immigrants | Sierra Leone
66.2
/100
|
#162
Good
$103,990