Welsh vs Immigrants from Liberia Median Female Earnings
COMPARE
Welsh
Immigrants from Liberia
Median Female Earnings
Median Female Earnings Comparison
Welsh
Immigrants from Liberia
$37,856
MEDIAN FEMALE EARNINGS
2.1/ 100
METRIC RATING
251st/ 347
METRIC RANK
$37,970
MEDIAN FEMALE EARNINGS
2.7/ 100
METRIC RATING
244th/ 347
METRIC RANK
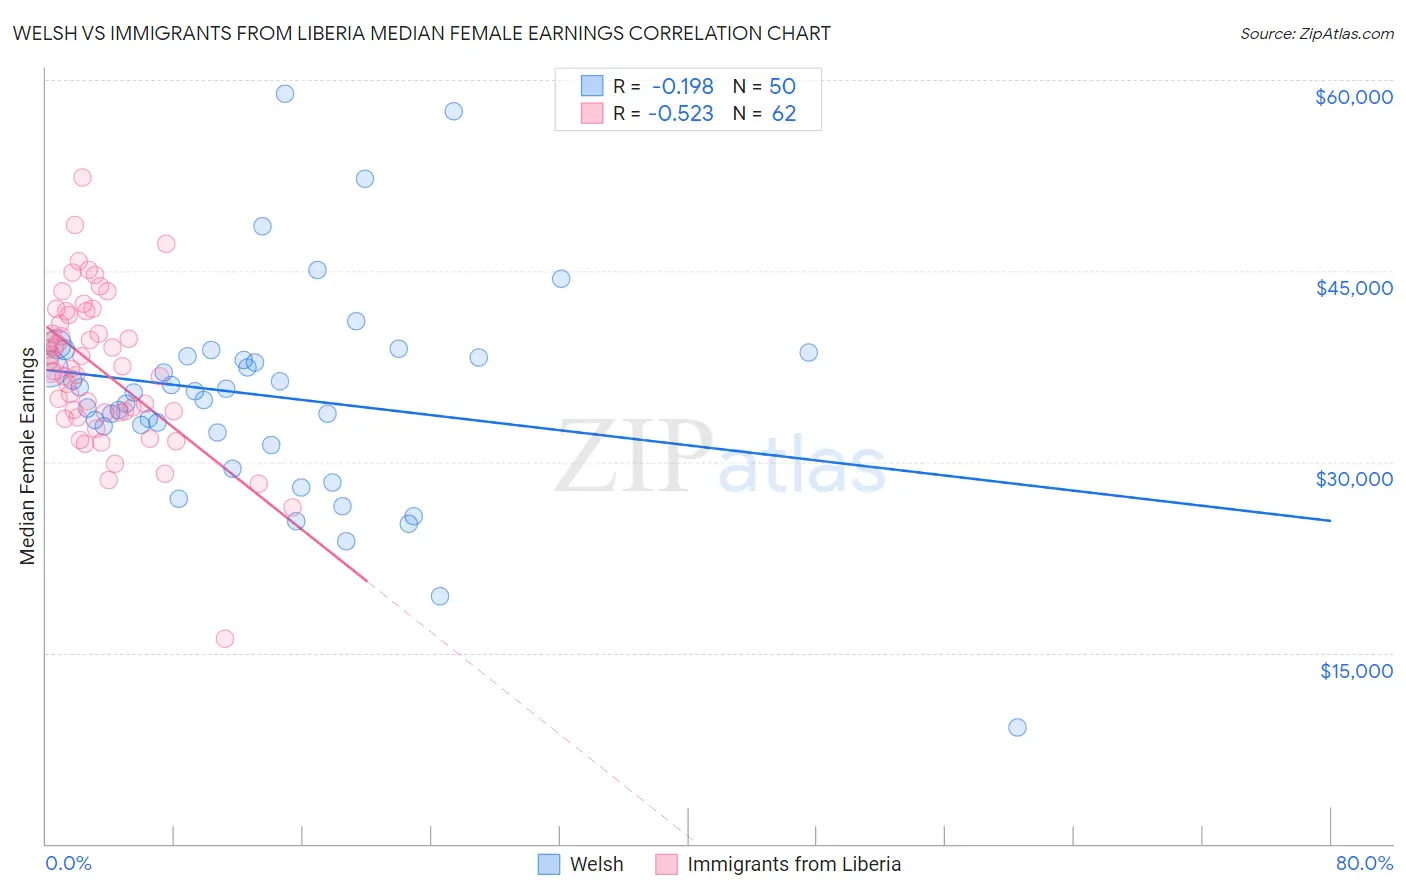
Welsh vs Immigrants from Liberia Median Female Earnings Correlation Chart
The statistical analysis conducted on geographies consisting of 527,602,521 people shows a poor negative correlation between the proportion of Welsh and median female earnings in the United States with a correlation coefficient (R) of -0.198 and weighted average of $37,856. Similarly, the statistical analysis conducted on geographies consisting of 135,268,038 people shows a substantial negative correlation between the proportion of Immigrants from Liberia and median female earnings in the United States with a correlation coefficient (R) of -0.523 and weighted average of $37,970, a difference of 0.30%.
Median Female Earnings Correlation Summary
| Measurement | Welsh | Immigrants from Liberia |
| Minimum | $9,167 | $16,076 |
| Maximum | $58,927 | $52,381 |
| Range | $49,760 | $36,305 |
| Mean | $35,195 | $37,357 |
| Median | $35,531 | $37,425 |
| Interquartile 25% (IQ1) | $32,290 | $33,898 |
| Interquartile 75% (IQ3) | $38,296 | $41,557 |
| Interquartile Range (IQR) | $6,005 | $7,659 |
| Standard Deviation (Sample) | $8,494 | $5,953 |
| Standard Deviation (Population) | $8,409 | $5,904 |
Demographics Similar to Welsh and Immigrants from Liberia by Median Female Earnings
In terms of median female earnings, the demographic groups most similar to Welsh are Immigrants from Iraq ($37,864, a difference of 0.020%), Immigrants from Dominica ($37,825, a difference of 0.080%), Alaskan Athabascan ($37,905, a difference of 0.13%), Swiss ($37,904, a difference of 0.13%), and Immigrants from Somalia ($37,914, a difference of 0.15%). Similarly, the demographic groups most similar to Immigrants from Liberia are Immigrants from Middle Africa ($37,965, a difference of 0.010%), Delaware ($37,964, a difference of 0.010%), German ($37,986, a difference of 0.040%), Immigrants from Burma/Myanmar ($38,028, a difference of 0.15%), and Immigrants from Somalia ($37,914, a difference of 0.15%).
| Demographics | Rating | Rank | Median Female Earnings |
| Immigrants | Cabo Verde | 4.3 /100 | #237 | Tragic $38,208 |
| Alaska Natives | 4.3 /100 | #238 | Tragic $38,202 |
| English | 4.2 /100 | #239 | Tragic $38,196 |
| Finns | 4.0 /100 | #240 | Tragic $38,173 |
| Spanish | 3.5 /100 | #241 | Tragic $38,098 |
| Immigrants | Burma/Myanmar | 3.0 /100 | #242 | Tragic $38,028 |
| Germans | 2.8 /100 | #243 | Tragic $37,986 |
| Immigrants | Liberia | 2.7 /100 | #244 | Tragic $37,970 |
| Immigrants | Middle Africa | 2.7 /100 | #245 | Tragic $37,965 |
| Delaware | 2.6 /100 | #246 | Tragic $37,964 |
| Immigrants | Somalia | 2.4 /100 | #247 | Tragic $37,914 |
| Alaskan Athabascans | 2.3 /100 | #248 | Tragic $37,905 |
| Swiss | 2.3 /100 | #249 | Tragic $37,904 |
| Immigrants | Iraq | 2.2 /100 | #250 | Tragic $37,864 |
| Welsh | 2.1 /100 | #251 | Tragic $37,856 |
| Immigrants | Dominica | 2.0 /100 | #252 | Tragic $37,825 |
| Danes | 1.6 /100 | #253 | Tragic $37,730 |
| Whites/Caucasians | 1.1 /100 | #254 | Tragic $37,531 |
| Colville | 1.1 /100 | #255 | Tragic $37,514 |
| Samoans | 1.0 /100 | #256 | Tragic $37,498 |
| Hawaiians | 1.0 /100 | #257 | Tragic $37,497 |