Vietnamese vs Immigrants from Western Asia Median Family Income

COMPARE

Vietnamese
Race
Ancestry
AfghanAfricanAlaska NativeAlaskan AthabascanAlbanianAleutAlsatianAmericanApacheArabArapahoArgentineanArmenianAssyrian/Chaldean/SyriacAustralianAustrianBahamianBangladeshiBarbadianBasqueBelgianBelizeanBermudanBhutaneseBlackfeetBolivianBrazilianBritishBritish West IndianBulgarianBurmeseCajunCambodianCanadianCape VerdeanCarpatho RusynCelticCentral AmericanCentral American IndianCherokeeCheyenneChickasawChileanChineseChippewaChoctawColombianColvilleComancheCosta RicanCreeCreekCroatianCrowCubanCypriotCzechCzechoslovakianDanishDelawareDominicanDutchDutch West IndianEastern EuropeanEcuadorianEgyptianEnglishEstonianEthiopianEuropeanFijianFilipinoFinnishFrenchFrench American IndianFrench CanadianGermanGerman RussianGhanaianGreekGuamanian/ChamorroGuatemalanGuyaneseHaitianHmongHonduranHopiHoumaHungarianIcelanderIndian (Asian)IndonesianInupiatIranianIraqiIrishIroquoisIsraeliItalianJamaicanJapaneseJordanianKenyanKiowaKoreanLaotianLatvianLebaneseLiberianLithuanianLumbeeLuxembourgerMacedonianMalaysianMalteseMarshalleseMenomineeMexicanMexican American IndianMongolianMoroccanNative HawaiianNavajoNepaleseNew ZealanderNicaraguanNigerianNorthern EuropeanNorwegianOkinawanOsageOttawaPaiutePakistaniPalestinianPanamanianParaguayanPennsylvania GermanPeruvianPimaPolishPortuguesePotawatomiPuebloPuerto RicanPuget Sound SalishRomanianRussianSalvadoranSamoanScandinavianScotch-IrishScottishSeminoleSenegaleseSerbianShoshoneSierra LeoneanSiouxSlavicSlovakSloveneSomaliSouth AfricanSouth AmericanSouth American IndianSoviet UnionSpaniardSpanishSpanish AmericanSpanish American IndianSri LankanSubsaharan AfricanSudaneseSwedishSwissSyrianTaiwaneseThaiTlingit-HaidaTohono O'OdhamTonganTrinidadian and TobagonianTsimshianTurkishU.S. Virgin IslanderUgandanUkrainianUruguayanUteVenezuelanVietnameseWelshWest IndianYakamaYaquiYugoslavianYumanYup'ikZimbabwean
Immigration
NonimmigrantsImmigrantsAfghanistanAfricaAlbaniaArgentinaArmeniaAsiaAustraliaAustriaBahamasBangladeshBarbadosBelarusBelgiumBelizeBoliviaBosnia and HerzegovinaBrazilBulgariaBurma/MyanmarCabo VerdeCambodiaCameroonCanadaCaribbeanCentral AmericaChileChinaColombiaCongoCosta RicaCroatiaCubaCzechoslovakiaDenmarkDominicaDominican RepublicEastern AfricaEastern AsiaEastern EuropeEcuadorEgyptEl SalvadorEnglandEritreaEthiopiaEuropeFijiFranceGermanyGhanaGreeceGrenadaGuatemalaGuyanaHaitiHondurasHong KongHungaryIndiaIndonesiaIranIraqIrelandIsraelItalyJamaicaJapanJordanKazakhstanKenyaKoreaKuwaitLaosLatin AmericaLatviaLebanonLiberiaLithuaniaMalaysiaMexicoMicronesiaMiddle AfricaMoldovaMoroccoNepalNetherlandsNicaraguaNigeriaNorth AmericaNorth MacedoniaNorthern AfricaNorthern EuropeNorwayOceaniaPakistanPanamaPeruPhilippinesPolandPortugalRomaniaRussiaSaudi ArabiaScotlandSenegalSerbiaSierra LeoneSingaporeSomaliaSouth AfricaSouth AmericaSouth Central AsiaSouth Eastern AsiaSouthern EuropeSpainSri LankaSt. Vincent and the GrenadinesSudanSwedenSwitzerlandSyriaTaiwanThailandTrinidad and TobagoTurkeyUgandaUkraineUruguayUzbekistanVenezuelaVietnamWest IndiesWestern AfricaWestern EuropeYemenZaireZimbabweAzores
Immigrants from Western Asia
Race
Ancestry
AfghanAfricanAlaska NativeAlaskan AthabascanAlbanianAleutAlsatianAmericanApacheArabArapahoArgentineanArmenianAssyrian/Chaldean/SyriacAustralianAustrianBahamianBangladeshiBarbadianBasqueBelgianBelizeanBermudanBhutaneseBlackfeetBolivianBrazilianBritishBritish West IndianBulgarianBurmeseCajunCambodianCanadianCape VerdeanCarpatho RusynCelticCentral AmericanCentral American IndianCherokeeCheyenneChickasawChileanChineseChippewaChoctawColombianColvilleComancheCosta RicanCreeCreekCroatianCrowCubanCypriotCzechCzechoslovakianDanishDelawareDominicanDutchDutch West IndianEastern EuropeanEcuadorianEgyptianEnglishEstonianEthiopianEuropeanFijianFilipinoFinnishFrenchFrench American IndianFrench CanadianGermanGerman RussianGhanaianGreekGuamanian/ChamorroGuatemalanGuyaneseHaitianHmongHonduranHopiHoumaHungarianIcelanderIndian (Asian)IndonesianInupiatIranianIraqiIrishIroquoisIsraeliItalianJamaicanJapaneseJordanianKenyanKiowaKoreanLaotianLatvianLebaneseLiberianLithuanianLumbeeLuxembourgerMacedonianMalaysianMalteseMarshalleseMenomineeMexicanMexican American IndianMongolianMoroccanNative HawaiianNavajoNepaleseNew ZealanderNicaraguanNigerianNorthern EuropeanNorwegianOkinawanOsageOttawaPaiutePakistaniPalestinianPanamanianParaguayanPennsylvania GermanPeruvianPimaPolishPortuguesePotawatomiPuebloPuerto RicanPuget Sound SalishRomanianRussianSalvadoranSamoanScandinavianScotch-IrishScottishSeminoleSenegaleseSerbianShoshoneSierra LeoneanSiouxSlavicSlovakSloveneSomaliSouth AfricanSouth AmericanSouth American IndianSoviet UnionSpaniardSpanishSpanish AmericanSpanish American IndianSri LankanSubsaharan AfricanSudaneseSwedishSwissSyrianTaiwaneseThaiTlingit-HaidaTohono O'OdhamTonganTrinidadian and TobagonianTsimshianTurkishU.S. Virgin IslanderUgandanUkrainianUruguayanUteVenezuelanWelshWest IndianYakamaYaquiYugoslavianYumanYup'ikZimbabwean
Immigration
NonimmigrantsImmigrantsAfghanistanAfricaAlbaniaArgentinaArmeniaAsiaAustraliaAustriaBahamasBangladeshBarbadosBelarusBelgiumBelizeBoliviaBosnia and HerzegovinaBrazilBulgariaBurma/MyanmarCabo VerdeCambodiaCameroonCanadaCaribbeanCentral AmericaChileChinaColombiaCongoCosta RicaCroatiaCubaCzechoslovakiaDenmarkDominicaDominican RepublicEastern AfricaEastern AsiaEastern EuropeEcuadorEgyptEl SalvadorEnglandEritreaEthiopiaEuropeFijiFranceGermanyGhanaGreeceGrenadaGuatemalaGuyanaHaitiHondurasHong KongHungaryIndiaIndonesiaIranIraqIrelandIsraelItalyJamaicaJapanJordanKazakhstanKenyaKoreaKuwaitLaosLatin AmericaLatviaLebanonLiberiaLithuaniaMalaysiaMexicoMicronesiaMiddle AfricaMoldovaMoroccoNepalNetherlandsNicaraguaNigeriaNorth AmericaNorth MacedoniaNorthern AfricaNorthern EuropeNorwayOceaniaPakistanPanamaPeruPhilippinesPolandPortugalRomaniaRussiaSaudi ArabiaScotlandSenegalSerbiaSierra LeoneSingaporeSomaliaSouth AfricaSouth AmericaSouth Central AsiaSouth Eastern AsiaSouthern EuropeSpainSri LankaSt. Vincent and the GrenadinesSudanSwedenSwitzerlandSyriaTaiwanThailandTrinidad and TobagoTurkeyUgandaUkraineUruguayUzbekistanVenezuelaVietnamWest IndiesWestern AfricaWestern AsiaWestern EuropeYemenZaireZimbabweAzores
Median Family Income
Income
Poverty
Unemployment
Labor Participation
Family Structure
Vehicle Availability
Education Level
Disability

Median Family Income Comparison

Vietnamese

Immigrants from Western Asia

Tragic
Exceptional
$96,123
MEDIAN FAMILY INCOME
3.4/ 100
METRIC RATING
225th/ 347
METRIC RANK
$108,691
MEDIAN FAMILY INCOME
95.6/ 100
METRIC RATING
111th/ 347
METRIC RANK

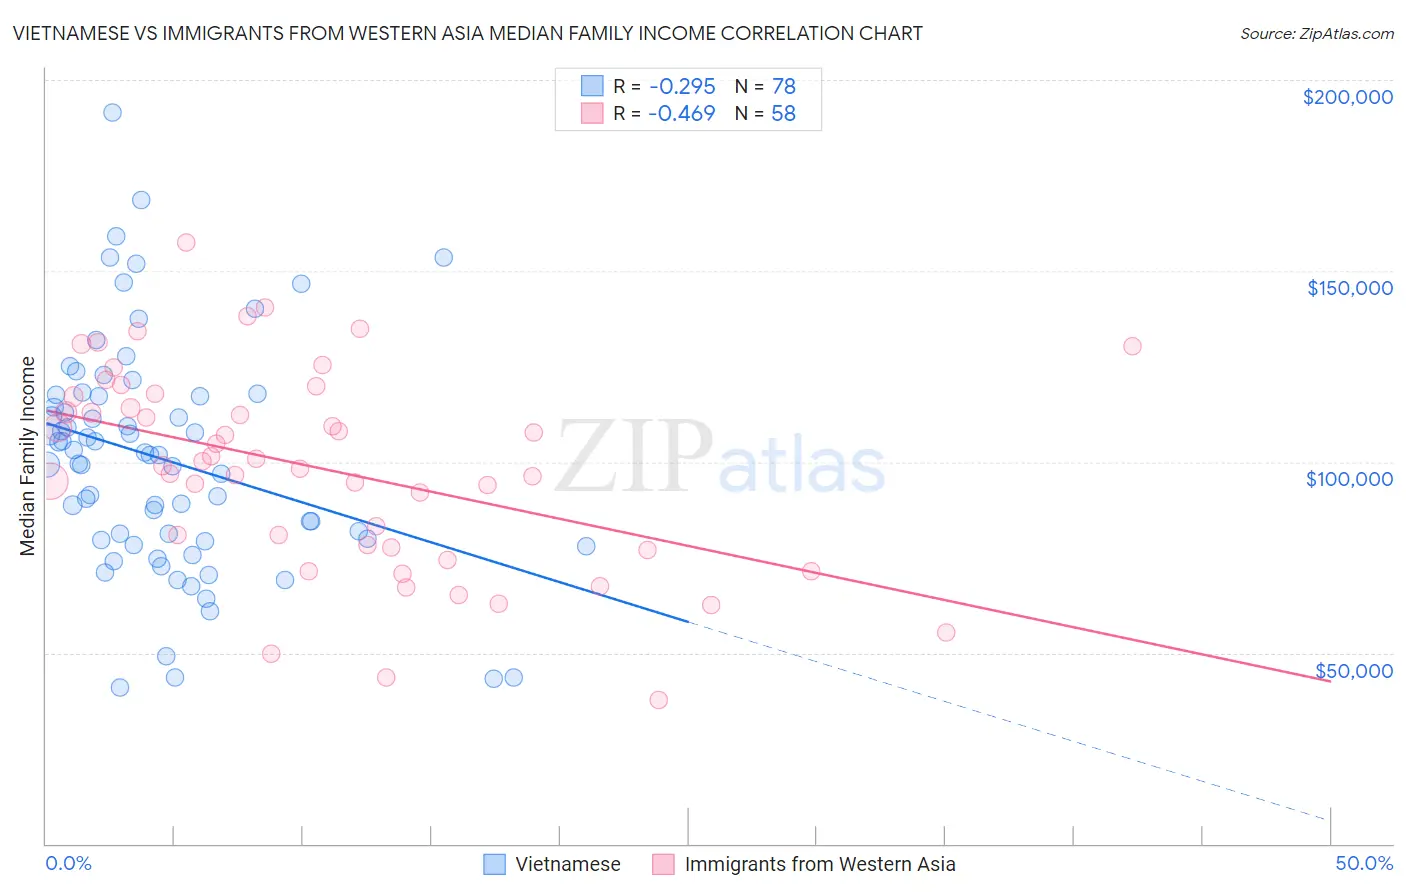
Vietnamese vs Immigrants from Western Asia Median Family Income Correlation Chart

The statistical analysis conducted on geographies consisting of 170,610,316 people shows a weak negative correlation between the proportion of Vietnamese and median family income in the United States with a correlation coefficient (R) of -0.295 and weighted average of $96,123. Similarly, the statistical analysis conducted on geographies consisting of 404,054,166 people shows a moderate negative correlation between the proportion of Immigrants from Western Asia and median family income in the United States with a correlation coefficient (R) of -0.469 and weighted average of $108,691, a difference of 13.1%.
Vietnamese vs Immigrants from Western Asia Median Family Income

Median Family Income Correlation Summary

MeasurementVietnameseImmigrants from Western Asia
Minimum$40,807$37,540
Maximum$191,643$157,455
Range$150,837$119,915
Mean$100,636$98,085
Median$101,824$99,522
Interquartile 25% (IQ1)$79,608$77,576
Interquartile 75% (IQ3)$117,250$117,037
Interquartile Range (IQR)$37,642$39,461
Standard Deviation (Sample)$30,077$26,265
Standard Deviation (Population)$29,884$26,038

Similar Demographics by Median Family Income

Demographics Similar to Vietnamese by Median Family Income

In terms of median family income, the demographic groups most similar to Vietnamese are Nonimmigrants ($96,231, a difference of 0.11%), Venezuelan ($96,281, a difference of 0.16%), Immigrants from Nigeria ($96,439, a difference of 0.33%), Immigrants from Ghana ($96,544, a difference of 0.44%), and Immigrants from Panama ($95,647, a difference of 0.50%).
DemographicsRating | RankMedian Family Income
Immigrants | Cambodia
5.8
/100
|
#218
Tragic
$97,222
Delaware
5.1
/100
|
#219
Tragic
$96,958
Sudanese
4.7
/100
|
#220
Tragic
$96,783
Immigrants | Ghana
4.2
/100
|
#221
Tragic
$96,544
Immigrants | Nigeria
4.0
/100
|
#222
Tragic
$96,439
Venezuelans
3.7
/100
|
#223
Tragic
$96,281
Immigrants | Nonimmigrants
3.6
/100
|
#224
Tragic
$96,231
Vietnamese
3.4
/100
|
#225
Tragic
$96,123
Immigrants | Panama
2.7
/100
|
#226
Tragic
$95,647
Alaska Natives
2.6
/100
|
#227
Tragic
$95,573
Immigrants | Azores
2.4
/100
|
#228
Tragic
$95,402
Marshallese
2.2
/100
|
#229
Tragic
$95,293
Malaysians
2.2
/100
|
#230
Tragic
$95,230
Ecuadorians
2.1
/100
|
#231
Tragic
$95,114
Immigrants | Venezuela
1.9
/100
|
#232
Tragic
$94,904

Demographics Similar to Immigrants from Western Asia by Median Family Income

In terms of median family income, the demographic groups most similar to Immigrants from Western Asia are British ($108,705, a difference of 0.010%), Immigrants from Afghanistan ($108,709, a difference of 0.020%), Immigrants from Poland ($108,570, a difference of 0.11%), Immigrants from Zimbabwe ($108,830, a difference of 0.13%), and Immigrants from Saudi Arabia ($108,544, a difference of 0.14%).
DemographicsRating | RankMedian Family Income
Palestinians
96.9
/100
|
#104
Exceptional
$109,413
Syrians
96.7
/100
|
#105
Exceptional
$109,299
Albanians
96.4
/100
|
#106
Exceptional
$109,136
Immigrants | North Macedonia
96.4
/100
|
#107
Exceptional
$109,136
Immigrants | Zimbabwe
95.9
/100
|
#108
Exceptional
$108,830
Immigrants | Afghanistan
95.6
/100
|
#109
Exceptional
$108,709
British
95.6
/100
|
#110
Exceptional
$108,705
Immigrants | Western Asia
95.6
/100
|
#111
Exceptional
$108,691
Immigrants | Poland
95.3
/100
|
#112
Exceptional
$108,570
Immigrants | Saudi Arabia
95.2
/100
|
#113
Exceptional
$108,544
Poles
95.2
/100
|
#114
Exceptional
$108,507
Swedes
95.1
/100
|
#115
Exceptional
$108,499
Chileans
95.0
/100
|
#116
Exceptional
$108,429
Immigrants | Philippines
94.6
/100
|
#117
Exceptional
$108,288
Ethiopians
94.5
/100
|
#118
Exceptional
$108,251