Venezuelan vs Danish Householder Income Ages 45 - 64 years
COMPARE
Venezuelan
Danish
Householder Income Ages 45 - 64 years
Householder Income Ages 45 - 64 years Comparison
Venezuelans
Danes
$96,460
HOUSEHOLDER INCOME AGES 45 - 64 YEARS
12.6/ 100
METRIC RATING
212th/ 347
METRIC RANK
$105,619
HOUSEHOLDER INCOME AGES 45 - 64 YEARS
93.4/ 100
METRIC RATING
123rd/ 347
METRIC RANK
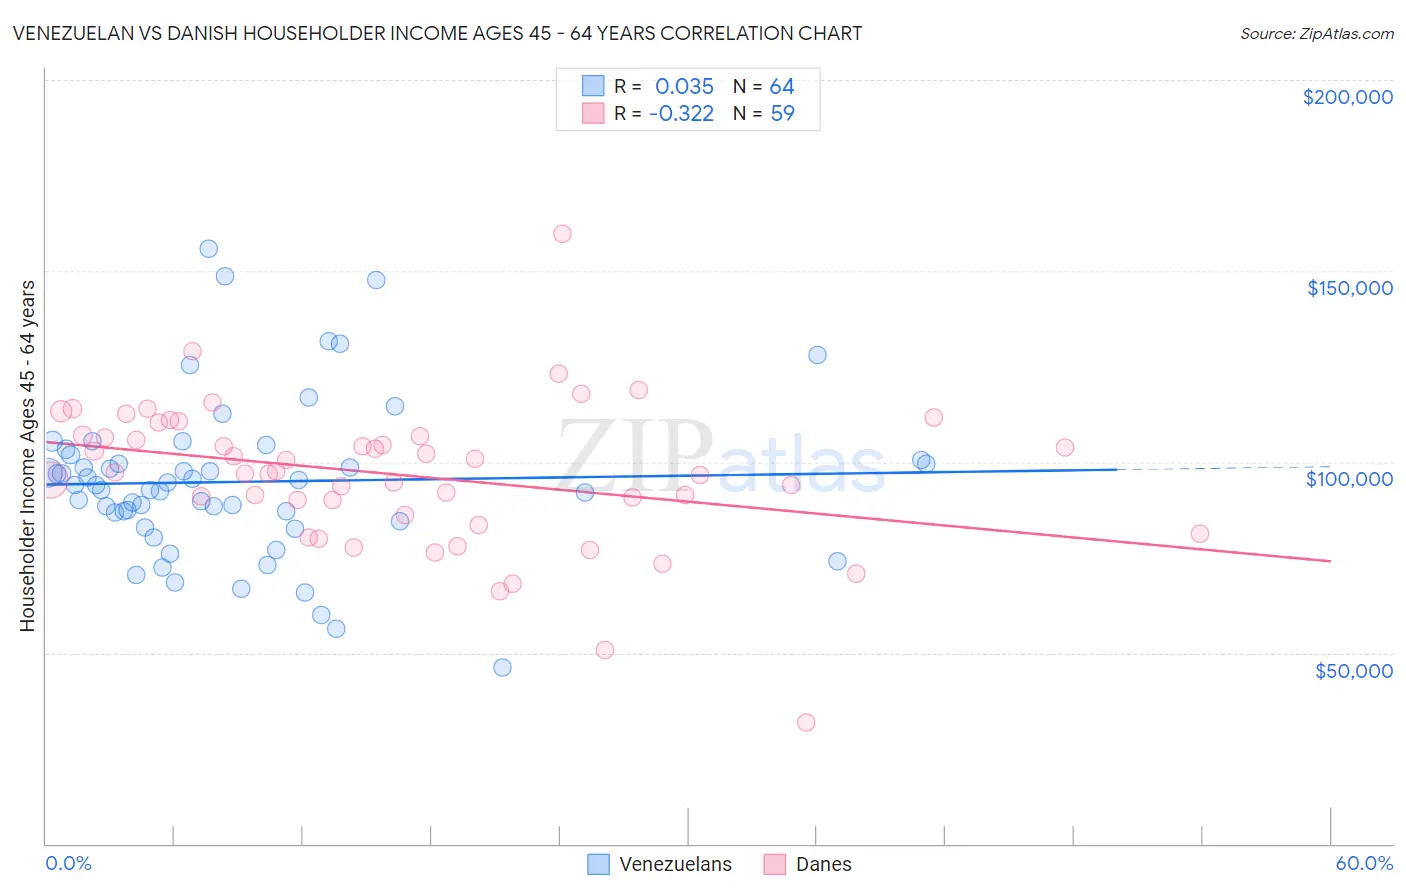
Venezuelan vs Danish Householder Income Ages 45 - 64 years Correlation Chart
The statistical analysis conducted on geographies consisting of 305,898,329 people shows no correlation between the proportion of Venezuelans and household income with householder between the ages 45 and 64 in the United States with a correlation coefficient (R) of 0.035 and weighted average of $96,460. Similarly, the statistical analysis conducted on geographies consisting of 472,904,213 people shows a mild negative correlation between the proportion of Danes and household income with householder between the ages 45 and 64 in the United States with a correlation coefficient (R) of -0.322 and weighted average of $105,619, a difference of 9.5%.
Householder Income Ages 45 - 64 years Correlation Summary
| Measurement | Venezuelan | Danish |
| Minimum | $46,250 | $31,738 |
| Maximum | $155,899 | $159,821 |
| Range | $109,649 | $128,083 |
| Mean | $94,776 | $96,518 |
| Median | $94,033 | $97,157 |
| Interquartile 25% (IQ1) | $85,499 | $86,244 |
| Interquartile 75% (IQ3) | $101,274 | $106,951 |
| Interquartile Range (IQR) | $15,775 | $20,707 |
| Standard Deviation (Sample) | $20,798 | $19,437 |
| Standard Deviation (Population) | $20,635 | $19,272 |
Similar Demographics by Householder Income Ages 45 - 64 years
Demographics Similar to Venezuelans by Householder Income Ages 45 - 64 years
In terms of householder income ages 45 - 64 years, the demographic groups most similar to Venezuelans are Immigrants from Cambodia ($96,537, a difference of 0.080%), Tsimshian ($96,783, a difference of 0.34%), Japanese ($96,834, a difference of 0.39%), Immigrants from Uruguay ($96,086, a difference of 0.39%), and Panamanian ($96,066, a difference of 0.41%).
| Demographics | Rating | Rank | Householder Income Ages 45 - 64 years |
| Immigrants | Colombia | 18.0 /100 | #205 | Poor $97,290 |
| Immigrants | Africa | 17.9 /100 | #206 | Poor $97,284 |
| Ghanaians | 17.9 /100 | #207 | Poor $97,277 |
| Scotch-Irish | 16.4 /100 | #208 | Poor $97,073 |
| Japanese | 14.8 /100 | #209 | Poor $96,834 |
| Tsimshian | 14.5 /100 | #210 | Poor $96,783 |
| Immigrants | Cambodia | 13.0 /100 | #211 | Poor $96,537 |
| Venezuelans | 12.6 /100 | #212 | Poor $96,460 |
| Immigrants | Uruguay | 10.7 /100 | #213 | Poor $96,086 |
| Panamanians | 10.6 /100 | #214 | Poor $96,066 |
| Nigerians | 8.2 /100 | #215 | Tragic $95,492 |
| Immigrants | Venezuela | 7.6 /100 | #216 | Tragic $95,342 |
| Immigrants | Ghana | 6.4 /100 | #217 | Tragic $94,982 |
| Delaware | 6.2 /100 | #218 | Tragic $94,914 |
| Immigrants | Armenia | 6.1 /100 | #219 | Tragic $94,863 |
Demographics Similar to Danes by Householder Income Ages 45 - 64 years
In terms of householder income ages 45 - 64 years, the demographic groups most similar to Danes are Immigrants from Northern Africa ($105,430, a difference of 0.18%), Immigrants from North Macedonia ($105,892, a difference of 0.26%), Pakistani ($105,317, a difference of 0.29%), Portuguese ($105,309, a difference of 0.29%), and Polish ($105,952, a difference of 0.32%).
| Demographics | Rating | Rank | Householder Income Ages 45 - 64 years |
| British | 95.2 /100 | #116 | Exceptional $106,264 |
| Albanians | 95.1 /100 | #117 | Exceptional $106,243 |
| Immigrants | Western Asia | 95.0 /100 | #118 | Exceptional $106,217 |
| Immigrants | Jordan | 94.9 /100 | #119 | Exceptional $106,164 |
| Immigrants | South Eastern Asia | 94.8 /100 | #120 | Exceptional $106,109 |
| Poles | 94.4 /100 | #121 | Exceptional $105,952 |
| Immigrants | North Macedonia | 94.2 /100 | #122 | Exceptional $105,892 |
| Danes | 93.4 /100 | #123 | Exceptional $105,619 |
| Immigrants | Northern Africa | 92.8 /100 | #124 | Exceptional $105,430 |
| Pakistanis | 92.4 /100 | #125 | Exceptional $105,317 |
| Portuguese | 92.4 /100 | #126 | Exceptional $105,309 |
| Immigrants | Saudi Arabia | 92.2 /100 | #127 | Exceptional $105,249 |
| Native Hawaiians | 91.8 /100 | #128 | Exceptional $105,149 |
| Peruvians | 91.5 /100 | #129 | Exceptional $105,070 |
| Immigrants | Zimbabwe | 91.2 /100 | #130 | Exceptional $104,992 |