Ute vs Iranian Wage/Income Gap
COMPARE
Ute
Iranian
Wage/Income Gap
Wage/Income Gap Comparison
Ute
Iranians
27.8%
WAGE/INCOME GAP
0.8/ 100
METRIC RATING
271st/ 347
METRIC RANK
29.7%
WAGE/INCOME GAP
0.0/ 100
METRIC RATING
339th/ 347
METRIC RANK
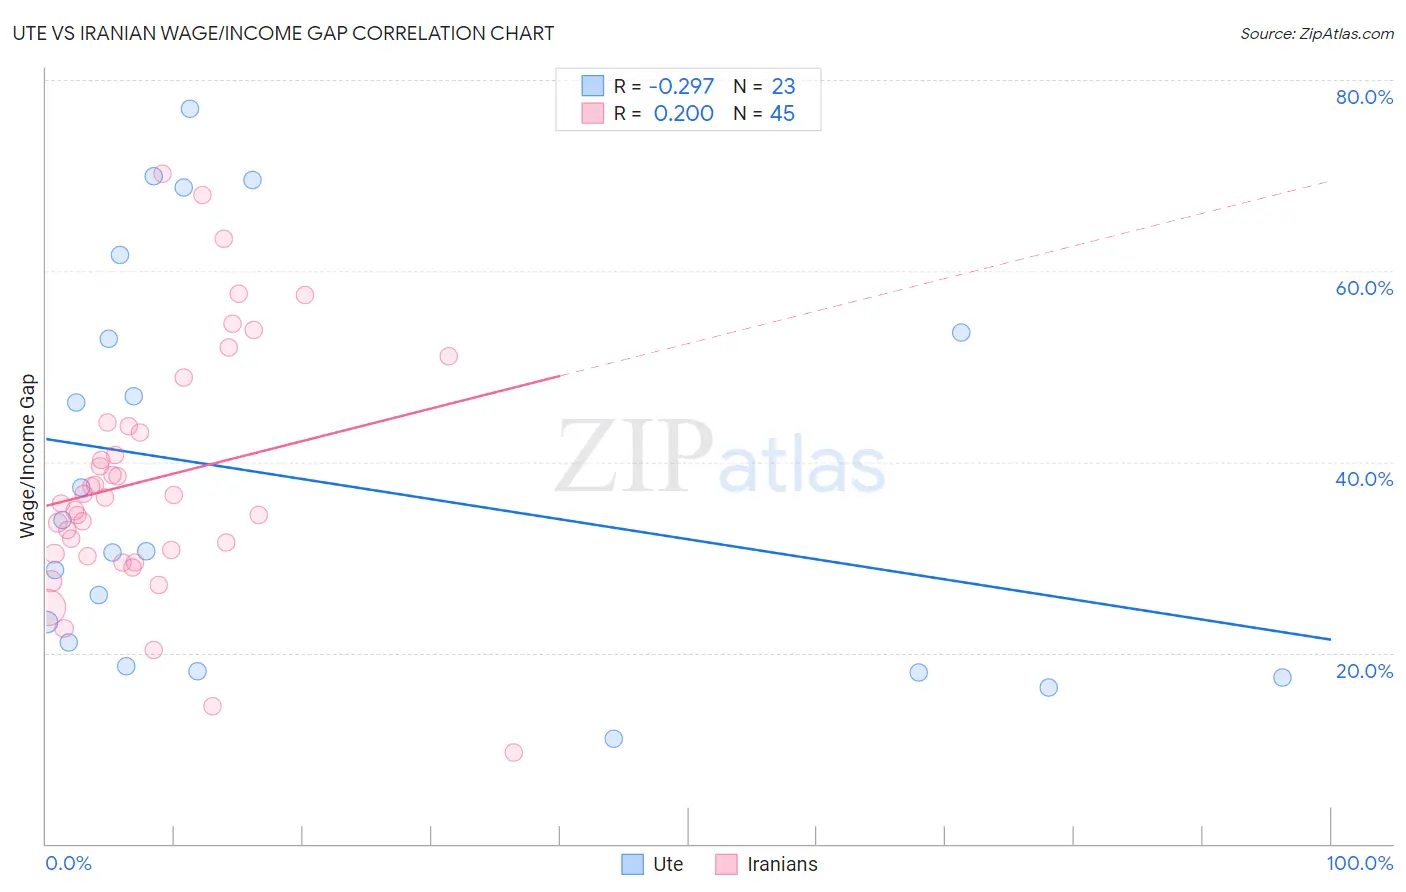
Ute vs Iranian Wage/Income Gap Correlation Chart
The statistical analysis conducted on geographies consisting of 55,649,950 people shows a weak negative correlation between the proportion of Ute and wage/income gap percentage in the United States with a correlation coefficient (R) of -0.297 and weighted average of 27.8%. Similarly, the statistical analysis conducted on geographies consisting of 316,773,224 people shows a weak positive correlation between the proportion of Iranians and wage/income gap percentage in the United States with a correlation coefficient (R) of 0.200 and weighted average of 29.7%, a difference of 7.0%.
Wage/Income Gap Correlation Summary
| Measurement | Ute | Iranian |
| Minimum | 11.0% | 9.6% |
| Maximum | 77.0% | 70.1% |
| Range | 66.0% | 60.5% |
| Mean | 38.1% | 38.2% |
| Median | 30.6% | 36.2% |
| Interquartile 25% (IQ1) | 18.6% | 30.2% |
| Interquartile 75% (IQ3) | 53.5% | 44.0% |
| Interquartile Range (IQR) | 34.9% | 13.8% |
| Standard Deviation (Sample) | 20.6% | 12.9% |
| Standard Deviation (Population) | 20.1% | 12.8% |
Similar Demographics by Wage/Income Gap
Demographics Similar to Ute by Wage/Income Gap
In terms of wage/income gap, the demographic groups most similar to Ute are Immigrants from Korea (27.8%, a difference of 0.070%), Immigrants from Western Europe (27.8%, a difference of 0.080%), Bulgarian (27.8%, a difference of 0.18%), Potawatomi (27.7%, a difference of 0.20%), and New Zealander (27.7%, a difference of 0.21%).
| Demographics | Rating | Rank | Wage/Income Gap |
| Immigrants | Switzerland | 1.0 /100 | #264 | Tragic 27.7% |
| Serbians | 1.0 /100 | #265 | Tragic 27.7% |
| Hmong | 1.0 /100 | #266 | Tragic 27.7% |
| Turks | 1.0 /100 | #267 | Tragic 27.7% |
| New Zealanders | 1.0 /100 | #268 | Tragic 27.7% |
| Potawatomi | 0.9 /100 | #269 | Tragic 27.7% |
| Immigrants | Western Europe | 0.9 /100 | #270 | Tragic 27.8% |
| Ute | 0.8 /100 | #271 | Tragic 27.8% |
| Immigrants | Korea | 0.8 /100 | #272 | Tragic 27.8% |
| Bulgarians | 0.7 /100 | #273 | Tragic 27.8% |
| Americans | 0.7 /100 | #274 | Tragic 27.8% |
| Immigrants | Japan | 0.7 /100 | #275 | Tragic 27.9% |
| Lebanese | 0.7 /100 | #276 | Tragic 27.9% |
| Latvians | 0.7 /100 | #277 | Tragic 27.9% |
| Immigrants | England | 0.6 /100 | #278 | Tragic 27.9% |
Demographics Similar to Iranians by Wage/Income Gap
In terms of wage/income gap, the demographic groups most similar to Iranians are Filipino (29.7%, a difference of 0.060%), Dutch (29.6%, a difference of 0.28%), Swiss (30.0%, a difference of 0.83%), English (29.5%, a difference of 0.86%), and Immigrants from Taiwan (29.5%, a difference of 0.87%).
| Demographics | Rating | Rank | Wage/Income Gap |
| Immigrants | South Central Asia | 0.0 /100 | #332 | Tragic 29.3% |
| Europeans | 0.0 /100 | #333 | Tragic 29.4% |
| Swedes | 0.0 /100 | #334 | Tragic 29.4% |
| Immigrants | Taiwan | 0.0 /100 | #335 | Tragic 29.5% |
| English | 0.0 /100 | #336 | Tragic 29.5% |
| Dutch | 0.0 /100 | #337 | Tragic 29.6% |
| Filipinos | 0.0 /100 | #338 | Tragic 29.7% |
| Iranians | 0.0 /100 | #339 | Tragic 29.7% |
| Swiss | 0.0 /100 | #340 | Tragic 30.0% |
| Thais | 0.0 /100 | #341 | Tragic 30.5% |
| Pennsylvania Germans | 0.0 /100 | #342 | Tragic 30.7% |
| Danes | 0.0 /100 | #343 | Tragic 31.0% |
| Assyrians/Chaldeans/Syriacs | 0.0 /100 | #344 | Tragic 31.0% |
| Immigrants | India | 0.0 /100 | #345 | Tragic 31.5% |
| Cajuns | 0.0 /100 | #346 | Tragic 33.9% |