U.S. Virgin Islander vs Tlingit-Haida Median Household Income
COMPARE
U.S. Virgin Islander
Tlingit-Haida
Median Household Income
Median Household Income Comparison
U.S. Virgin Islanders
Tlingit-Haida
$71,853
MEDIAN HOUSEHOLD INCOME
0.0/ 100
METRIC RATING
310th/ 347
METRIC RANK
$83,968
MEDIAN HOUSEHOLD INCOME
32.6/ 100
METRIC RATING
188th/ 347
METRIC RANK
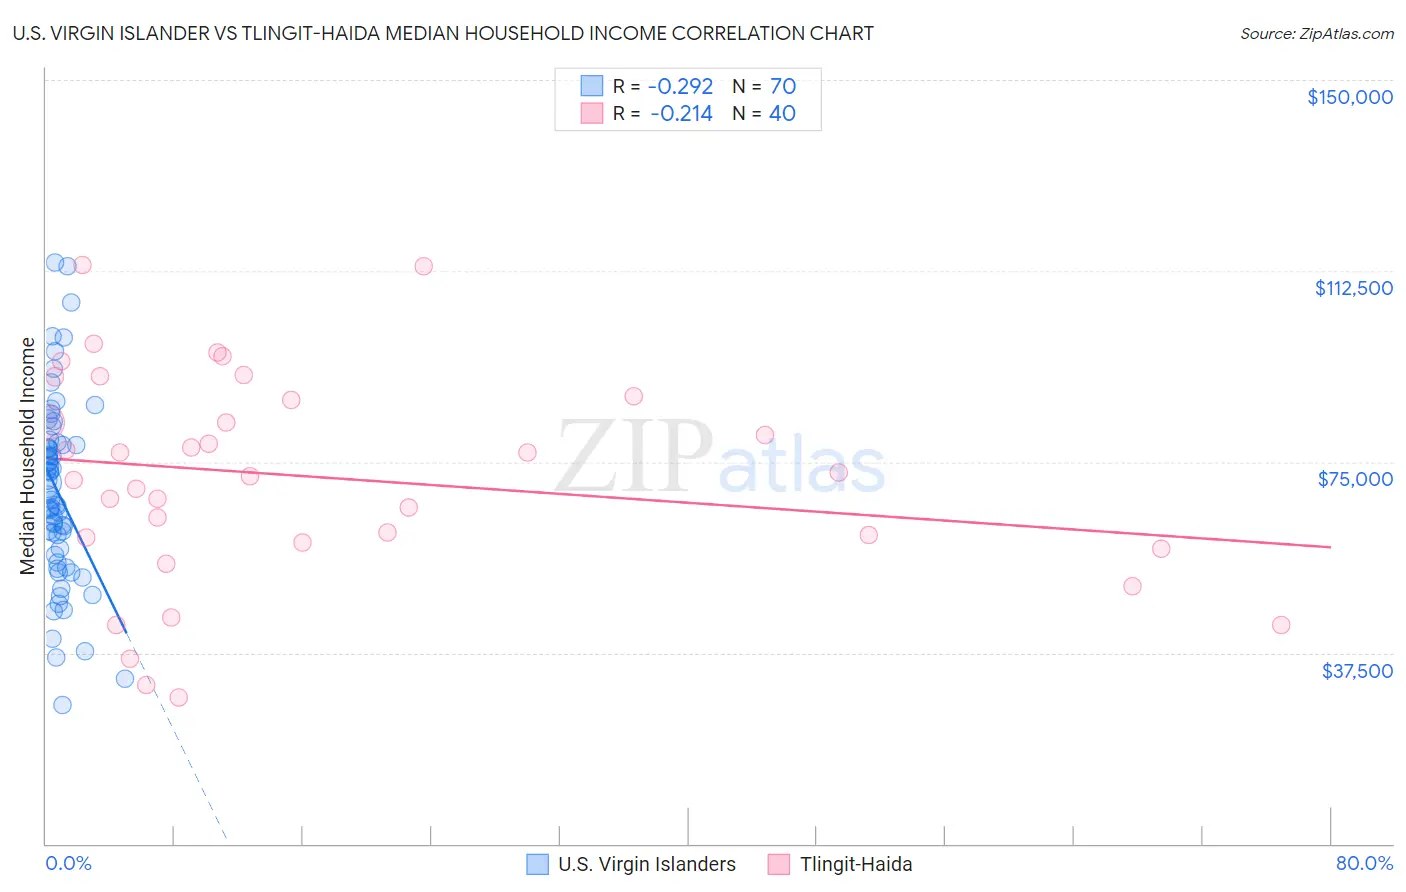
U.S. Virgin Islander vs Tlingit-Haida Median Household Income Correlation Chart
The statistical analysis conducted on geographies consisting of 87,500,449 people shows a weak negative correlation between the proportion of U.S. Virgin Islanders and median household income in the United States with a correlation coefficient (R) of -0.292 and weighted average of $71,853. Similarly, the statistical analysis conducted on geographies consisting of 60,854,436 people shows a weak negative correlation between the proportion of Tlingit-Haida and median household income in the United States with a correlation coefficient (R) of -0.214 and weighted average of $83,968, a difference of 16.9%.
Median Household Income Correlation Summary
| Measurement | U.S. Virgin Islander | Tlingit-Haida |
| Minimum | $27,212 | $28,750 |
| Maximum | $114,181 | $113,574 |
| Range | $86,969 | $84,824 |
| Mean | $69,001 | $71,962 |
| Median | $68,056 | $72,542 |
| Interquartile 25% (IQ1) | $56,650 | $59,644 |
| Interquartile 75% (IQ3) | $78,391 | $87,562 |
| Interquartile Range (IQR) | $21,741 | $27,918 |
| Standard Deviation (Sample) | $18,092 | $20,793 |
| Standard Deviation (Population) | $17,962 | $20,531 |
Similar Demographics by Median Household Income
Demographics Similar to U.S. Virgin Islanders by Median Household Income
In terms of median household income, the demographic groups most similar to U.S. Virgin Islanders are Immigrants from Caribbean ($71,860, a difference of 0.010%), Immigrants from Zaire ($71,801, a difference of 0.070%), Yakama ($72,225, a difference of 0.52%), Immigrants from Honduras ($71,452, a difference of 0.56%), and Immigrants from Bahamas ($71,349, a difference of 0.71%).
| Demographics | Rating | Rank | Median Household Income |
| Africans | 0.0 /100 | #303 | Tragic $72,650 |
| Immigrants | Haiti | 0.0 /100 | #304 | Tragic $72,599 |
| Hondurans | 0.0 /100 | #305 | Tragic $72,588 |
| Potawatomi | 0.0 /100 | #306 | Tragic $72,576 |
| Ute | 0.0 /100 | #307 | Tragic $72,402 |
| Yakama | 0.0 /100 | #308 | Tragic $72,225 |
| Immigrants | Caribbean | 0.0 /100 | #309 | Tragic $71,860 |
| U.S. Virgin Islanders | 0.0 /100 | #310 | Tragic $71,853 |
| Immigrants | Zaire | 0.0 /100 | #311 | Tragic $71,801 |
| Immigrants | Honduras | 0.0 /100 | #312 | Tragic $71,452 |
| Immigrants | Bahamas | 0.0 /100 | #313 | Tragic $71,349 |
| Dominicans | 0.0 /100 | #314 | Tragic $71,302 |
| Ottawa | 0.0 /100 | #315 | Tragic $70,984 |
| Apache | 0.0 /100 | #316 | Tragic $70,927 |
| Cajuns | 0.0 /100 | #317 | Tragic $70,605 |
Demographics Similar to Tlingit-Haida by Median Household Income
In terms of median household income, the demographic groups most similar to Tlingit-Haida are Puget Sound Salish ($84,011, a difference of 0.050%), Belgian ($84,008, a difference of 0.050%), Immigrants from Colombia ($83,902, a difference of 0.080%), Kenyan ($84,085, a difference of 0.14%), and Slovak ($83,798, a difference of 0.20%).
| Demographics | Rating | Rank | Median Household Income |
| Hawaiians | 44.1 /100 | #181 | Average $84,729 |
| Uruguayans | 43.5 /100 | #182 | Average $84,691 |
| Spaniards | 42.7 /100 | #183 | Average $84,644 |
| Immigrants | Eastern Africa | 37.4 /100 | #184 | Fair $84,299 |
| Kenyans | 34.2 /100 | #185 | Fair $84,085 |
| Puget Sound Salish | 33.2 /100 | #186 | Fair $84,011 |
| Belgians | 33.2 /100 | #187 | Fair $84,008 |
| Tlingit-Haida | 32.6 /100 | #188 | Fair $83,968 |
| Immigrants | Colombia | 31.7 /100 | #189 | Fair $83,902 |
| Slovaks | 30.2 /100 | #190 | Fair $83,798 |
| Iraqis | 29.6 /100 | #191 | Fair $83,753 |
| Welsh | 28.0 /100 | #192 | Fair $83,628 |
| Finns | 27.7 /100 | #193 | Fair $83,607 |
| Ghanaians | 27.4 /100 | #194 | Fair $83,582 |
| Immigrants | Armenia | 27.0 /100 | #195 | Fair $83,555 |