U.S. Virgin Islander vs Liberian Per Capita Income
COMPARE
U.S. Virgin Islander
Liberian
Per Capita Income
Per Capita Income Comparison
U.S. Virgin Islanders
Liberians
$37,589
PER CAPITA INCOME
0.1/ 100
METRIC RATING
289th/ 347
METRIC RANK
$38,780
PER CAPITA INCOME
0.4/ 100
METRIC RATING
268th/ 347
METRIC RANK
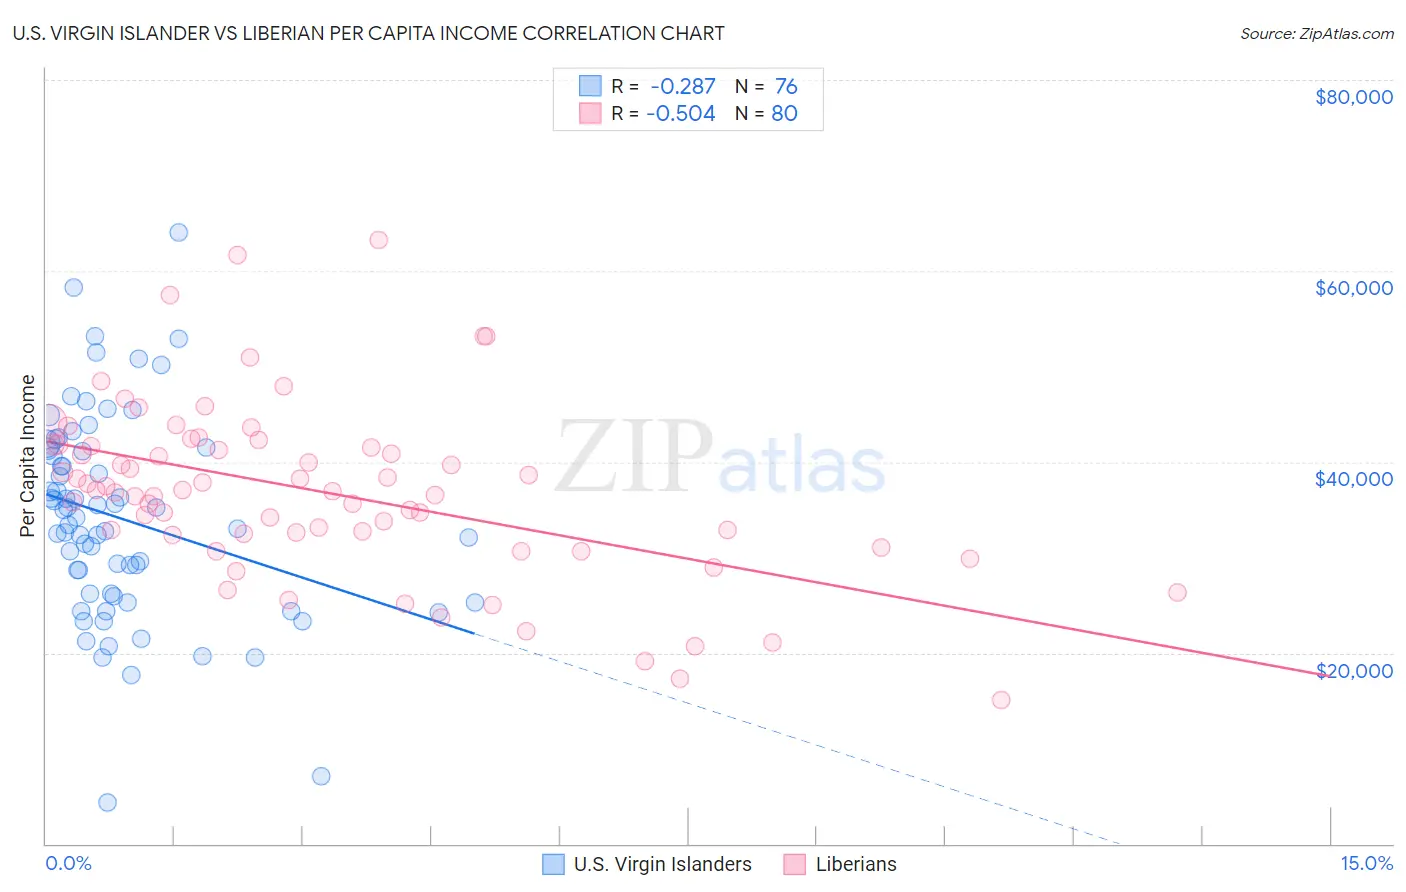
U.S. Virgin Islander vs Liberian Per Capita Income Correlation Chart
The statistical analysis conducted on geographies consisting of 87,529,979 people shows a weak negative correlation between the proportion of U.S. Virgin Islanders and per capita income in the United States with a correlation coefficient (R) of -0.287 and weighted average of $37,589. Similarly, the statistical analysis conducted on geographies consisting of 118,107,140 people shows a substantial negative correlation between the proportion of Liberians and per capita income in the United States with a correlation coefficient (R) of -0.504 and weighted average of $38,780, a difference of 3.2%.
Per Capita Income Correlation Summary
| Measurement | U.S. Virgin Islander | Liberian |
| Minimum | $4,326 | $15,041 |
| Maximum | $64,008 | $63,224 |
| Range | $59,682 | $48,183 |
| Mean | $34,023 | $36,863 |
| Median | $33,782 | $37,001 |
| Interquartile 25% (IQ1) | $26,044 | $32,406 |
| Interquartile 75% (IQ3) | $41,286 | $41,709 |
| Interquartile Range (IQR) | $15,242 | $9,304 |
| Standard Deviation (Sample) | $10,800 | $9,178 |
| Standard Deviation (Population) | $10,729 | $9,120 |
Similar Demographics by Per Capita Income
Demographics Similar to U.S. Virgin Islanders by Per Capita Income
In terms of per capita income, the demographic groups most similar to U.S. Virgin Islanders are Immigrants from Guatemala ($37,550, a difference of 0.10%), Cajun ($37,527, a difference of 0.16%), Blackfeet ($37,695, a difference of 0.28%), Central American Indian ($37,699, a difference of 0.29%), and Dominican ($37,697, a difference of 0.29%).
| Demographics | Rating | Rank | Per Capita Income |
| Immigrants | Laos | 0.1 /100 | #282 | Tragic $37,857 |
| Pennsylvania Germans | 0.1 /100 | #283 | Tragic $37,842 |
| Africans | 0.1 /100 | #284 | Tragic $37,785 |
| Guatemalans | 0.1 /100 | #285 | Tragic $37,766 |
| Central American Indians | 0.1 /100 | #286 | Tragic $37,699 |
| Dominicans | 0.1 /100 | #287 | Tragic $37,697 |
| Blackfeet | 0.1 /100 | #288 | Tragic $37,695 |
| U.S. Virgin Islanders | 0.1 /100 | #289 | Tragic $37,589 |
| Immigrants | Guatemala | 0.1 /100 | #290 | Tragic $37,550 |
| Cajuns | 0.1 /100 | #291 | Tragic $37,527 |
| Immigrants | Micronesia | 0.1 /100 | #292 | Tragic $37,464 |
| Mexican American Indians | 0.1 /100 | #293 | Tragic $37,407 |
| Cubans | 0.1 /100 | #294 | Tragic $37,383 |
| Immigrants | Dominican Republic | 0.1 /100 | #295 | Tragic $37,306 |
| Indonesians | 0.1 /100 | #296 | Tragic $37,300 |
Demographics Similar to Liberians by Per Capita Income
In terms of per capita income, the demographic groups most similar to Liberians are Immigrants from Jamaica ($38,766, a difference of 0.040%), Immigrants from Zaire ($38,848, a difference of 0.17%), Salvadoran ($38,858, a difference of 0.20%), Immigrants from Belize ($38,614, a difference of 0.43%), and Central American ($38,560, a difference of 0.57%).
| Demographics | Rating | Rank | Per Capita Income |
| Marshallese | 0.6 /100 | #261 | Tragic $39,108 |
| Iroquois | 0.6 /100 | #262 | Tragic $39,104 |
| Belizeans | 0.6 /100 | #263 | Tragic $39,097 |
| Americans | 0.6 /100 | #264 | Tragic $39,039 |
| Spanish Americans | 0.5 /100 | #265 | Tragic $39,012 |
| Salvadorans | 0.5 /100 | #266 | Tragic $38,858 |
| Immigrants | Zaire | 0.4 /100 | #267 | Tragic $38,848 |
| Liberians | 0.4 /100 | #268 | Tragic $38,780 |
| Immigrants | Jamaica | 0.4 /100 | #269 | Tragic $38,766 |
| Immigrants | Belize | 0.3 /100 | #270 | Tragic $38,614 |
| Central Americans | 0.3 /100 | #271 | Tragic $38,560 |
| Immigrants | Cabo Verde | 0.3 /100 | #272 | Tragic $38,540 |
| Nepalese | 0.3 /100 | #273 | Tragic $38,442 |
| Immigrants | El Salvador | 0.3 /100 | #274 | Tragic $38,394 |
| Immigrants | Liberia | 0.2 /100 | #275 | Tragic $38,165 |