U.S. Virgin Islander vs Arab Householder Income Over 65 years

COMPARE

U.S. Virgin Islander
Race
Ancestry
AfghanAfricanAlaska NativeAlaskan AthabascanAlbanianAleutAlsatianAmericanApacheArapahoArgentineanArmenianAssyrian/Chaldean/SyriacAustralianAustrianBahamianBangladeshiBarbadianBasqueBelgianBelizeanBermudanBhutaneseBlackfeetBolivianBrazilianBritishBritish West IndianBulgarianBurmeseCajunCambodianCanadianCape VerdeanCarpatho RusynCelticCentral AmericanCentral American IndianCherokeeCheyenneChickasawChileanChineseChippewaChoctawColombianColvilleComancheCosta RicanCreeCreekCroatianCrowCubanCypriotCzechCzechoslovakianDanishDelawareDominicanDutchDutch West IndianEastern EuropeanEcuadorianEgyptianEnglishEstonianEthiopianEuropeanFijianFilipinoFinnishFrenchFrench American IndianFrench CanadianGermanGerman RussianGhanaianGreekGuamanian/ChamorroGuatemalanGuyaneseHaitianHmongHonduranHopiHoumaHungarianIcelanderIndian (Asian)IndonesianInupiatIranianIraqiIrishIroquoisIsraeliItalianJamaicanJapaneseJordanianKenyanKiowaKoreanLaotianLatvianLebaneseLiberianLithuanianLumbeeLuxembourgerMacedonianMalaysianMalteseMarshalleseMenomineeMexicanMexican American IndianMongolianMoroccanNative HawaiianNavajoNepaleseNew ZealanderNicaraguanNigerianNorthern EuropeanNorwegianOkinawanOsageOttawaPaiutePakistaniPalestinianPanamanianParaguayanPennsylvania GermanPeruvianPimaPolishPortuguesePotawatomiPuebloPuerto RicanPuget Sound SalishRomanianRussianSalvadoranSamoanScandinavianScotch-IrishScottishSeminoleSenegaleseSerbianShoshoneSierra LeoneanSiouxSlavicSlovakSloveneSomaliSouth AfricanSouth AmericanSouth American IndianSoviet UnionSpaniardSpanishSpanish AmericanSpanish American IndianSri LankanSubsaharan AfricanSudaneseSwedishSwissSyrianTaiwaneseThaiTlingit-HaidaTohono O'OdhamTonganTrinidadian and TobagonianTsimshianTurkishU.S. Virgin IslanderUgandanUkrainianUruguayanUteVenezuelanVietnameseWelshWest IndianYakamaYaquiYugoslavianYumanYup'ikZimbabwean
Immigration
NonimmigrantsImmigrantsAfghanistanAfricaAlbaniaArgentinaArmeniaAsiaAustraliaAustriaBahamasBangladeshBarbadosBelarusBelgiumBelizeBoliviaBosnia and HerzegovinaBrazilBulgariaBurma/MyanmarCabo VerdeCambodiaCameroonCanadaCaribbeanCentral AmericaChileChinaColombiaCongoCosta RicaCroatiaCubaCzechoslovakiaDenmarkDominicaDominican RepublicEastern AfricaEastern AsiaEastern EuropeEcuadorEgyptEl SalvadorEnglandEritreaEthiopiaEuropeFijiFranceGermanyGhanaGreeceGrenadaGuatemalaGuyanaHaitiHondurasHong KongHungaryIndiaIndonesiaIranIraqIrelandIsraelItalyJamaicaJapanJordanKazakhstanKenyaKoreaKuwaitLaosLatin AmericaLatviaLebanonLiberiaLithuaniaMalaysiaMexicoMicronesiaMiddle AfricaMoldovaMoroccoNepalNetherlandsNicaraguaNigeriaNorth AmericaNorth MacedoniaNorthern AfricaNorthern EuropeNorwayOceaniaPakistanPanamaPeruPhilippinesPolandPortugalRomaniaRussiaSaudi ArabiaScotlandSenegalSerbiaSierra LeoneSingaporeSomaliaSouth AfricaSouth AmericaSouth Central AsiaSouth Eastern AsiaSouthern EuropeSpainSri LankaSt. Vincent and the GrenadinesSudanSwedenSwitzerlandSyriaTaiwanThailandTrinidad and TobagoTurkeyUgandaUkraineUruguayUzbekistanVenezuelaVietnamWest IndiesWestern AfricaWestern AsiaWestern EuropeYemenZaireZimbabweAzores
Arab
Race
Ancestry
AfghanAfricanAlaska NativeAlaskan AthabascanAlbanianAleutAlsatianAmericanApacheArabArapahoArgentineanArmenianAssyrian/Chaldean/SyriacAustralianAustrianBahamianBangladeshiBarbadianBasqueBelgianBelizeanBermudanBhutaneseBlackfeetBolivianBrazilianBritishBritish West IndianBulgarianBurmeseCajunCambodianCanadianCape VerdeanCarpatho RusynCelticCentral AmericanCentral American IndianCherokeeCheyenneChickasawChileanChineseChippewaChoctawColombianColvilleComancheCosta RicanCreeCreekCroatianCrowCubanCypriotCzechCzechoslovakianDanishDelawareDominicanDutchDutch West IndianEastern EuropeanEcuadorianEgyptianEnglishEstonianEthiopianEuropeanFijianFilipinoFinnishFrenchFrench American IndianFrench CanadianGermanGerman RussianGhanaianGreekGuamanian/ChamorroGuatemalanGuyaneseHaitianHmongHonduranHopiHoumaHungarianIcelanderIndian (Asian)IndonesianInupiatIranianIraqiIrishIroquoisIsraeliItalianJamaicanJapaneseJordanianKenyanKiowaKoreanLaotianLatvianLebaneseLiberianLithuanianLumbeeLuxembourgerMacedonianMalaysianMalteseMarshalleseMenomineeMexicanMexican American IndianMongolianMoroccanNative HawaiianNavajoNepaleseNew ZealanderNicaraguanNigerianNorthern EuropeanNorwegianOkinawanOsageOttawaPaiutePakistaniPalestinianPanamanianParaguayanPennsylvania GermanPeruvianPimaPolishPortuguesePotawatomiPuebloPuerto RicanPuget Sound SalishRomanianRussianSalvadoranSamoanScandinavianScotch-IrishScottishSeminoleSenegaleseSerbianShoshoneSierra LeoneanSiouxSlavicSlovakSloveneSomaliSouth AfricanSouth AmericanSouth American IndianSoviet UnionSpaniardSpanishSpanish AmericanSpanish American IndianSri LankanSubsaharan AfricanSudaneseSwedishSwissSyrianTaiwaneseThaiTlingit-HaidaTohono O'OdhamTonganTrinidadian and TobagonianTsimshianTurkishUgandanUkrainianUruguayanUteVenezuelanVietnameseWelshWest IndianYakamaYaquiYugoslavianYumanYup'ikZimbabwean
Immigration
NonimmigrantsImmigrantsAfghanistanAfricaAlbaniaArgentinaArmeniaAsiaAustraliaAustriaBahamasBangladeshBarbadosBelarusBelgiumBelizeBoliviaBosnia and HerzegovinaBrazilBulgariaBurma/MyanmarCabo VerdeCambodiaCameroonCanadaCaribbeanCentral AmericaChileChinaColombiaCongoCosta RicaCroatiaCubaCzechoslovakiaDenmarkDominicaDominican RepublicEastern AfricaEastern AsiaEastern EuropeEcuadorEgyptEl SalvadorEnglandEritreaEthiopiaEuropeFijiFranceGermanyGhanaGreeceGrenadaGuatemalaGuyanaHaitiHondurasHong KongHungaryIndiaIndonesiaIranIraqIrelandIsraelItalyJamaicaJapanJordanKazakhstanKenyaKoreaKuwaitLaosLatin AmericaLatviaLebanonLiberiaLithuaniaMalaysiaMexicoMicronesiaMiddle AfricaMoldovaMoroccoNepalNetherlandsNicaraguaNigeriaNorth AmericaNorth MacedoniaNorthern AfricaNorthern EuropeNorwayOceaniaPakistanPanamaPeruPhilippinesPolandPortugalRomaniaRussiaSaudi ArabiaScotlandSenegalSerbiaSierra LeoneSingaporeSomaliaSouth AfricaSouth AmericaSouth Central AsiaSouth Eastern AsiaSouthern EuropeSpainSri LankaSt. Vincent and the GrenadinesSudanSwedenSwitzerlandSyriaTaiwanThailandTrinidad and TobagoTurkeyUgandaUkraineUruguayUzbekistanVenezuelaVietnamWest IndiesWestern AfricaWestern AsiaWestern EuropeYemenZaireZimbabweAzores
Householder Income Over 65 years
Income
Poverty
Unemployment
Labor Participation
Family Structure
Vehicle Availability
Education Level
Disability

Householder Income Over 65 years Comparison

U.S. Virgin Islanders

Arabs

Tragic
Good
$52,072
HOUSEHOLDER INCOME OVER 65 YEARS
0.0/ 100
METRIC RATING
315th/ 347
METRIC RANK
$62,266
HOUSEHOLDER INCOME OVER 65 YEARS
79.6/ 100
METRIC RATING
140th/ 347
METRIC RANK

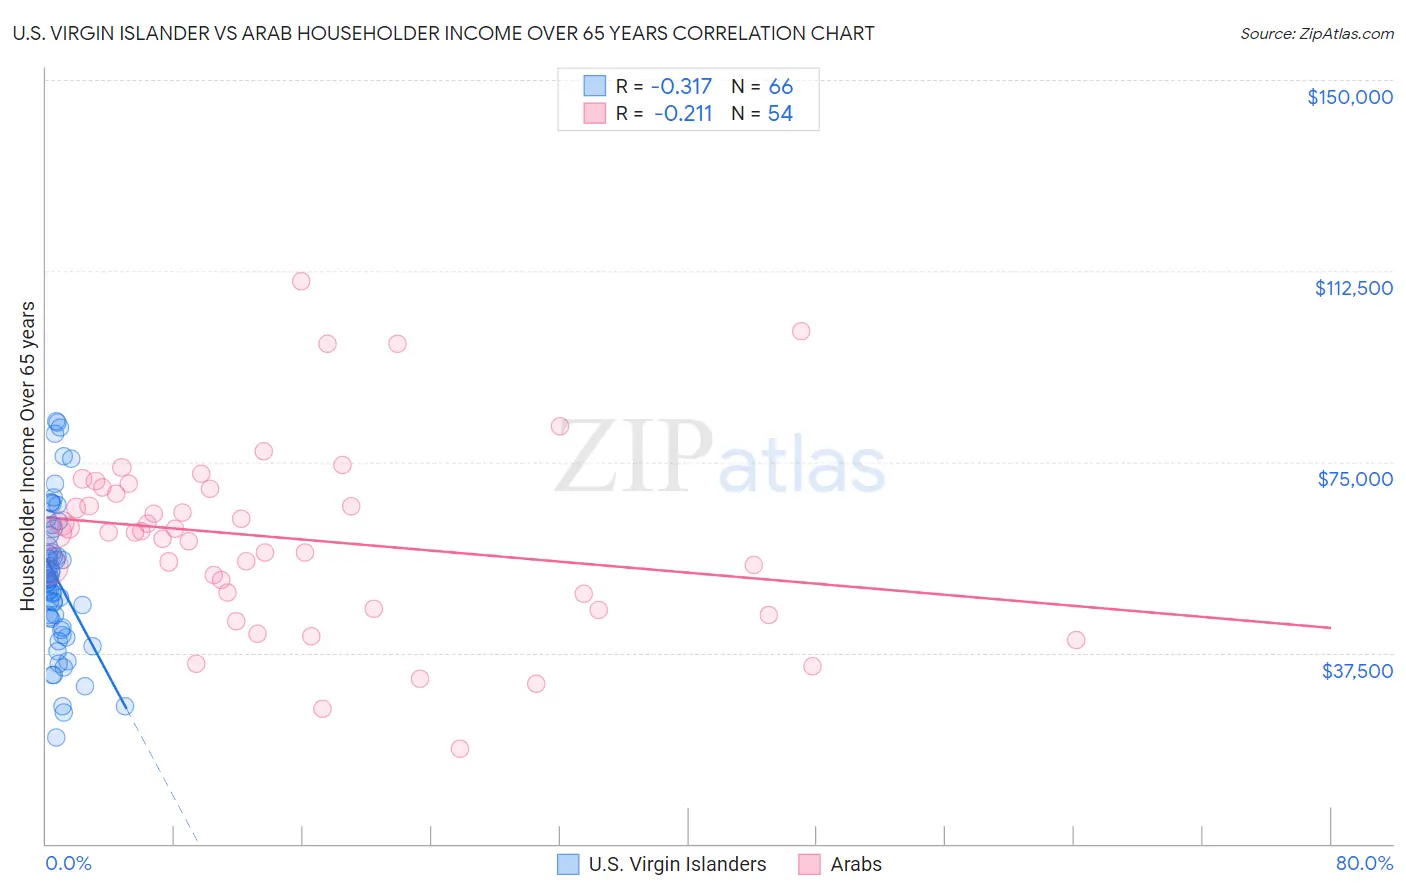
U.S. Virgin Islander vs Arab Householder Income Over 65 years Correlation Chart

The statistical analysis conducted on geographies consisting of 87,439,612 people shows a mild negative correlation between the proportion of U.S. Virgin Islanders and household income with householder over the age of 65 in the United States with a correlation coefficient (R) of -0.317 and weighted average of $52,072. Similarly, the statistical analysis conducted on geographies consisting of 484,580,257 people shows a weak negative correlation between the proportion of Arabs and household income with householder over the age of 65 in the United States with a correlation coefficient (R) of -0.211 and weighted average of $62,266, a difference of 19.6%.
U.S. Virgin Islander vs Arab Householder Income Over 65 years

Householder Income Over 65 years Correlation Summary

MeasurementU.S. Virgin IslanderArab
Minimum$20,842$18,625
Maximum$83,077$110,553
Range$62,235$91,928
Mean$51,986$59,915
Median$51,771$61,186
Interquartile 25% (IQ1)$42,565$48,984
Interquartile 75% (IQ3)$60,681$69,644
Interquartile Range (IQR)$18,116$20,660
Standard Deviation (Sample)$14,250$18,146
Standard Deviation (Population)$14,142$17,978

Similar Demographics by Householder Income Over 65 years

Demographics Similar to U.S. Virgin Islanders by Householder Income Over 65 years

In terms of householder income over 65 years, the demographic groups most similar to U.S. Virgin Islanders are Immigrants from Nicaragua ($52,085, a difference of 0.020%), Native/Alaskan ($52,081, a difference of 0.020%), Immigrants from the Azores ($52,121, a difference of 0.090%), Creek ($51,949, a difference of 0.24%), and Immigrants from St. Vincent and the Grenadines ($51,922, a difference of 0.29%).
DemographicsRating | RankHouseholder Income Over 65 years
Immigrants | Mexico
0.0
/100
|
#308
Tragic
$52,801
Hondurans
0.0
/100
|
#309
Tragic
$52,634
Sioux
0.0
/100
|
#310
Tragic
$52,509
Seminole
0.0
/100
|
#311
Tragic
$52,373
Immigrants | Azores
0.0
/100
|
#312
Tragic
$52,121
Immigrants | Nicaragua
0.0
/100
|
#313
Tragic
$52,085
Natives/Alaskans
0.0
/100
|
#314
Tragic
$52,081
U.S. Virgin Islanders
0.0
/100
|
#315
Tragic
$52,072
Creek
0.0
/100
|
#316
Tragic
$51,949
Immigrants | St. Vincent and the Grenadines
0.0
/100
|
#317
Tragic
$51,922
Haitians
0.0
/100
|
#318
Tragic
$51,912
Immigrants | Honduras
0.0
/100
|
#319
Tragic
$51,888
Colville
0.0
/100
|
#320
Tragic
$51,739
Menominee
0.0
/100
|
#321
Tragic
$51,719
British West Indians
0.0
/100
|
#322
Tragic
$51,463

Demographics Similar to Arabs by Householder Income Over 65 years

In terms of householder income over 65 years, the demographic groups most similar to Arabs are Lebanese ($62,287, a difference of 0.030%), Immigrants from Kazakhstan ($62,292, a difference of 0.040%), Immigrants from Syria ($62,303, a difference of 0.060%), Canadian ($62,230, a difference of 0.060%), and South American Indian ($62,215, a difference of 0.080%).
DemographicsRating | RankHouseholder Income Over 65 years
Immigrants | Northern Africa
83.6
/100
|
#133
Excellent
$62,522
Immigrants | Brazil
81.2
/100
|
#134
Excellent
$62,364
Immigrants | Chile
81.0
/100
|
#135
Excellent
$62,354
Alaskan Athabascans
80.6
/100
|
#136
Excellent
$62,330
Immigrants | Syria
80.2
/100
|
#137
Excellent
$62,303
Immigrants | Kazakhstan
80.0
/100
|
#138
Excellent
$62,292
Lebanese
79.9
/100
|
#139
Good
$62,287
Arabs
79.6
/100
|
#140
Good
$62,266
Canadians
79.0
/100
|
#141
Good
$62,230
South American Indians
78.7
/100
|
#142
Good
$62,215
Immigrants | Belarus
77.8
/100
|
#143
Good
$62,162
Immigrants | Peru
74.4
/100
|
#144
Good
$61,988
Immigrants | Uganda
74.2
/100
|
#145
Good
$61,976
Immigrants | Southern Europe
72.7
/100
|
#146
Good
$61,902
Immigrants | Nepal
71.4
/100
|
#147
Good
$61,843