Uruguayan vs Puget Sound Salish Per Capita Income
COMPARE
Uruguayan
Puget Sound Salish
Per Capita Income
Per Capita Income Comparison
Uruguayans
Puget Sound Salish
$44,318
PER CAPITA INCOME
67.6/ 100
METRIC RATING
155th/ 347
METRIC RANK
$41,495
PER CAPITA INCOME
8.1/ 100
METRIC RATING
219th/ 347
METRIC RANK
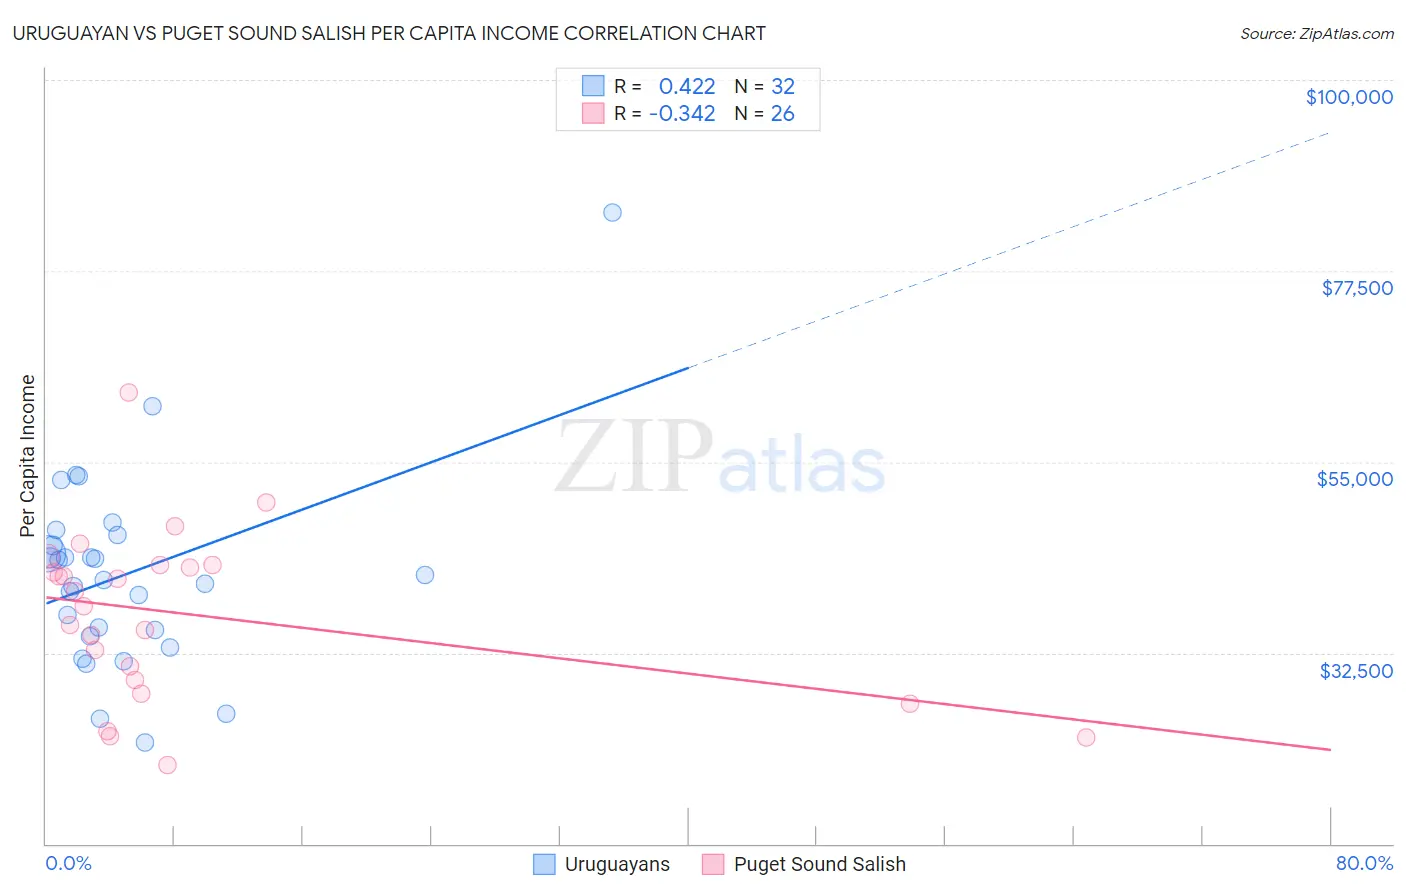
Uruguayan vs Puget Sound Salish Per Capita Income Correlation Chart
The statistical analysis conducted on geographies consisting of 144,785,218 people shows a moderate positive correlation between the proportion of Uruguayans and per capita income in the United States with a correlation coefficient (R) of 0.422 and weighted average of $44,318. Similarly, the statistical analysis conducted on geographies consisting of 46,155,865 people shows a mild negative correlation between the proportion of Puget Sound Salish and per capita income in the United States with a correlation coefficient (R) of -0.342 and weighted average of $41,495, a difference of 6.8%.
Per Capita Income Correlation Summary
| Measurement | Uruguayan | Puget Sound Salish |
| Minimum | $21,859 | $19,247 |
| Maximum | $84,313 | $63,213 |
| Range | $62,454 | $43,966 |
| Mean | $41,831 | $37,040 |
| Median | $41,436 | $38,913 |
| Interquartile 25% (IQ1) | $34,824 | $29,363 |
| Interquartile 75% (IQ3) | $45,774 | $42,776 |
| Interquartile Range (IQR) | $10,950 | $13,413 |
| Standard Deviation (Sample) | $11,692 | $10,042 |
| Standard Deviation (Population) | $11,508 | $9,847 |
Similar Demographics by Per Capita Income
Demographics Similar to Uruguayans by Per Capita Income
In terms of per capita income, the demographic groups most similar to Uruguayans are Portuguese ($44,362, a difference of 0.10%), Slovak ($44,229, a difference of 0.20%), South American Indian ($44,206, a difference of 0.25%), Scottish ($44,440, a difference of 0.27%), and Immigrants from Nepal ($44,187, a difference of 0.30%).
| Demographics | Rating | Rank | Per Capita Income |
| Immigrants | Armenia | 73.1 /100 | #148 | Good $44,552 |
| Koreans | 72.5 /100 | #149 | Good $44,522 |
| Immigrants | Eritrea | 72.1 /100 | #150 | Good $44,509 |
| Norwegians | 71.5 /100 | #151 | Good $44,480 |
| Peruvians | 71.5 /100 | #152 | Good $44,479 |
| Scottish | 70.6 /100 | #153 | Good $44,440 |
| Portuguese | 68.7 /100 | #154 | Good $44,362 |
| Uruguayans | 67.6 /100 | #155 | Good $44,318 |
| Slovaks | 65.4 /100 | #156 | Good $44,229 |
| South American Indians | 64.8 /100 | #157 | Good $44,206 |
| Immigrants | Nepal | 64.3 /100 | #158 | Good $44,187 |
| South Americans | 62.4 /100 | #159 | Good $44,114 |
| Danes | 61.9 /100 | #160 | Good $44,095 |
| Costa Ricans | 61.8 /100 | #161 | Good $44,090 |
| Swiss | 61.4 /100 | #162 | Good $44,076 |
Demographics Similar to Puget Sound Salish by Per Capita Income
In terms of per capita income, the demographic groups most similar to Puget Sound Salish are Immigrants from Barbados ($41,478, a difference of 0.040%), Immigrants from Trinidad and Tobago ($41,476, a difference of 0.040%), Immigrants from Iraq ($41,365, a difference of 0.31%), Trinidadian and Tobagonian ($41,655, a difference of 0.39%), and Immigrants from Cameroon ($41,334, a difference of 0.39%).
| Demographics | Rating | Rank | Per Capita Income |
| Immigrants | Senegal | 11.3 /100 | #212 | Poor $41,830 |
| Immigrants | Venezuela | 10.2 /100 | #213 | Poor $41,727 |
| Immigrants | Bangladesh | 10.1 /100 | #214 | Poor $41,709 |
| Sudanese | 9.9 /100 | #215 | Tragic $41,695 |
| Tongans | 9.9 /100 | #216 | Tragic $41,693 |
| Guamanians/Chamorros | 9.7 /100 | #217 | Tragic $41,678 |
| Trinidadians and Tobagonians | 9.5 /100 | #218 | Tragic $41,655 |
| Puget Sound Salish | 8.1 /100 | #219 | Tragic $41,495 |
| Immigrants | Barbados | 7.9 /100 | #220 | Tragic $41,478 |
| Immigrants | Trinidad and Tobago | 7.9 /100 | #221 | Tragic $41,476 |
| Immigrants | Iraq | 7.1 /100 | #222 | Tragic $41,365 |
| Immigrants | Cameroon | 6.8 /100 | #223 | Tragic $41,334 |
| Immigrants | St. Vincent and the Grenadines | 6.4 /100 | #224 | Tragic $41,270 |
| West Indians | 6.0 /100 | #225 | Tragic $41,217 |
| Immigrants | Ecuador | 5.9 /100 | #226 | Tragic $41,195 |