Ukrainian vs Immigrants from Lithuania Householder Income Ages 45 - 64 years
COMPARE
Ukrainian
Immigrants from Lithuania
Householder Income Ages 45 - 64 years
Householder Income Ages 45 - 64 years Comparison
Ukrainians
Immigrants from Lithuania
$108,475
HOUSEHOLDER INCOME AGES 45 - 64 YEARS
98.3/ 100
METRIC RATING
89th/ 347
METRIC RANK
$114,336
HOUSEHOLDER INCOME AGES 45 - 64 YEARS
99.9/ 100
METRIC RATING
41st/ 347
METRIC RANK
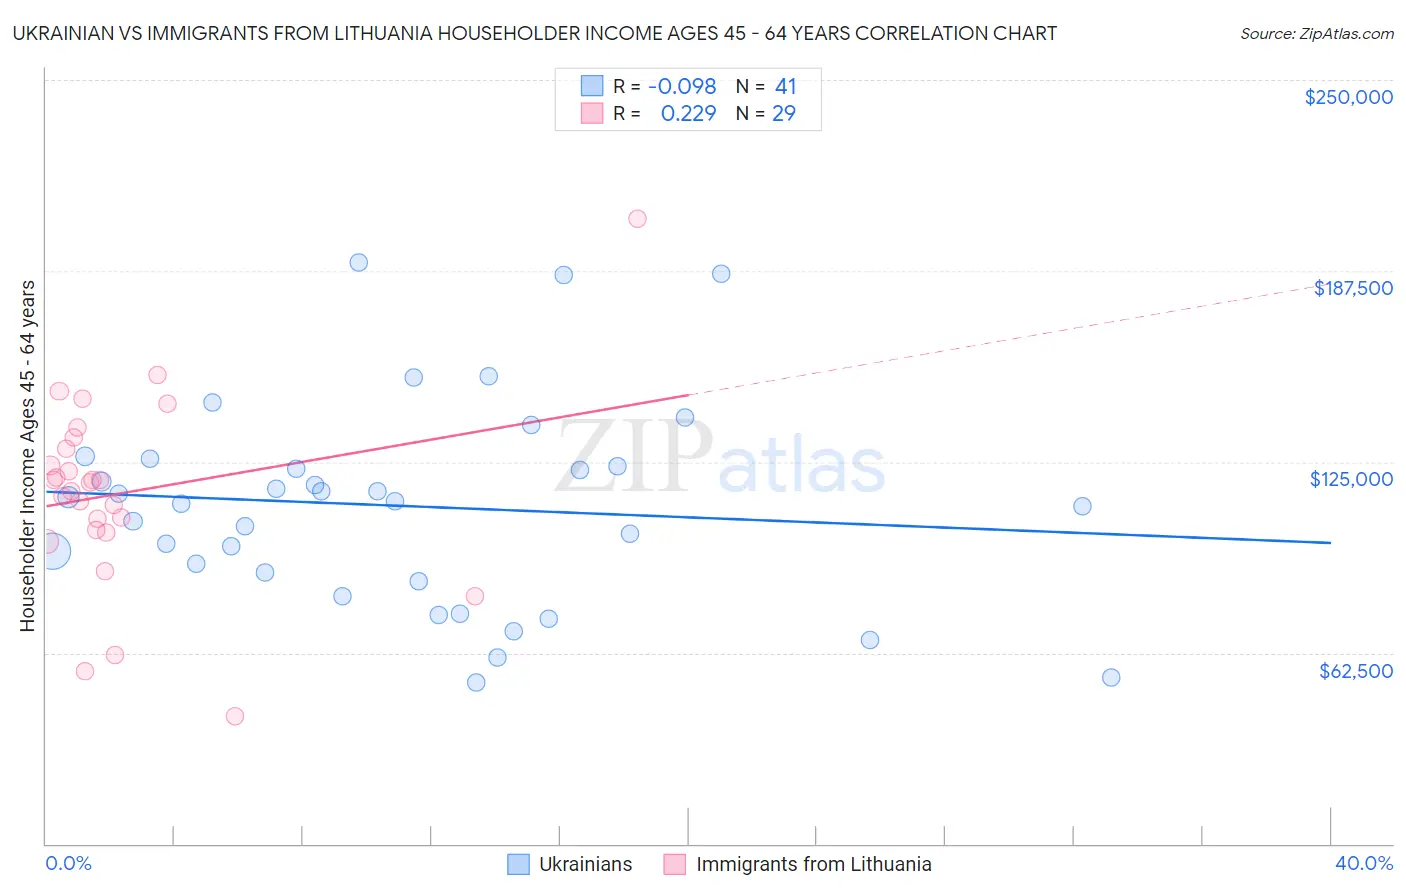
Ukrainian vs Immigrants from Lithuania Householder Income Ages 45 - 64 years Correlation Chart
The statistical analysis conducted on geographies consisting of 447,644,777 people shows a slight negative correlation between the proportion of Ukrainians and household income with householder between the ages 45 and 64 in the United States with a correlation coefficient (R) of -0.098 and weighted average of $108,475. Similarly, the statistical analysis conducted on geographies consisting of 117,696,258 people shows a weak positive correlation between the proportion of Immigrants from Lithuania and household income with householder between the ages 45 and 64 in the United States with a correlation coefficient (R) of 0.229 and weighted average of $114,336, a difference of 5.4%.
Householder Income Ages 45 - 64 years Correlation Summary
| Measurement | Ukrainian | Immigrants from Lithuania |
| Minimum | $52,773 | $41,667 |
| Maximum | $190,426 | $204,500 |
| Range | $137,653 | $162,833 |
| Mean | $110,581 | $114,986 |
| Median | $112,021 | $118,271 |
| Interquartile 25% (IQ1) | $87,227 | $102,220 |
| Interquartile 75% (IQ3) | $124,770 | $131,130 |
| Interquartile Range (IQR) | $37,542 | $28,910 |
| Standard Deviation (Sample) | $33,465 | $31,501 |
| Standard Deviation (Population) | $33,054 | $30,953 |
Similar Demographics by Householder Income Ages 45 - 64 years
Demographics Similar to Ukrainians by Householder Income Ages 45 - 64 years
In terms of householder income ages 45 - 64 years, the demographic groups most similar to Ukrainians are Immigrants from Philippines ($108,471, a difference of 0.0%), Immigrants from Lebanon ($108,471, a difference of 0.0%), Croatian ($108,383, a difference of 0.080%), Romanian ($108,609, a difference of 0.12%), and Tongan ($108,643, a difference of 0.16%).
| Demographics | Rating | Rank | Householder Income Ages 45 - 64 years |
| Immigrants | North America | 98.8 /100 | #82 | Exceptional $109,198 |
| Immigrants | Spain | 98.8 /100 | #83 | Exceptional $109,051 |
| Immigrants | Western Europe | 98.6 /100 | #84 | Exceptional $108,824 |
| Immigrants | Afghanistan | 98.6 /100 | #85 | Exceptional $108,785 |
| Austrians | 98.5 /100 | #86 | Exceptional $108,692 |
| Tongans | 98.5 /100 | #87 | Exceptional $108,643 |
| Romanians | 98.5 /100 | #88 | Exceptional $108,609 |
| Ukrainians | 98.3 /100 | #89 | Exceptional $108,475 |
| Immigrants | Philippines | 98.3 /100 | #90 | Exceptional $108,471 |
| Immigrants | Lebanon | 98.3 /100 | #91 | Exceptional $108,471 |
| Croatians | 98.3 /100 | #92 | Exceptional $108,383 |
| Immigrants | Croatia | 98.2 /100 | #93 | Exceptional $108,304 |
| Sri Lankans | 98.2 /100 | #94 | Exceptional $108,270 |
| Immigrants | Hungary | 98.2 /100 | #95 | Exceptional $108,267 |
| Immigrants | Argentina | 98.2 /100 | #96 | Exceptional $108,264 |
Demographics Similar to Immigrants from Lithuania by Householder Income Ages 45 - 64 years
In terms of householder income ages 45 - 64 years, the demographic groups most similar to Immigrants from Lithuania are Cambodian ($114,342, a difference of 0.010%), Immigrants from Turkey ($114,407, a difference of 0.060%), Immigrants from Pakistan ($114,434, a difference of 0.090%), Estonian ($114,220, a difference of 0.10%), and Israeli ($114,186, a difference of 0.13%).
| Demographics | Rating | Rank | Householder Income Ages 45 - 64 years |
| Immigrants | Denmark | 100.0 /100 | #34 | Exceptional $116,000 |
| Latvians | 100.0 /100 | #35 | Exceptional $115,957 |
| Immigrants | Switzerland | 100.0 /100 | #36 | Exceptional $115,934 |
| Maltese | 99.9 /100 | #37 | Exceptional $114,754 |
| Immigrants | Pakistan | 99.9 /100 | #38 | Exceptional $114,434 |
| Immigrants | Turkey | 99.9 /100 | #39 | Exceptional $114,407 |
| Cambodians | 99.9 /100 | #40 | Exceptional $114,342 |
| Immigrants | Lithuania | 99.9 /100 | #41 | Exceptional $114,336 |
| Estonians | 99.9 /100 | #42 | Exceptional $114,220 |
| Israelis | 99.9 /100 | #43 | Exceptional $114,186 |
| Bulgarians | 99.9 /100 | #44 | Exceptional $113,883 |
| Immigrants | France | 99.9 /100 | #45 | Exceptional $113,680 |
| Immigrants | Greece | 99.9 /100 | #46 | Exceptional $113,548 |
| Australians | 99.9 /100 | #47 | Exceptional $113,533 |
| Immigrants | Indonesia | 99.9 /100 | #48 | Exceptional $113,519 |