Ukrainian vs Immigrants from Ethiopia Median Male Earnings
COMPARE
Ukrainian
Immigrants from Ethiopia
Median Male Earnings
Median Male Earnings Comparison
Ukrainians
Immigrants from Ethiopia
$59,728
MEDIAN MALE EARNINGS
99.4/ 100
METRIC RATING
81st/ 347
METRIC RANK
$55,434
MEDIAN MALE EARNINGS
71.6/ 100
METRIC RATING
156th/ 347
METRIC RANK
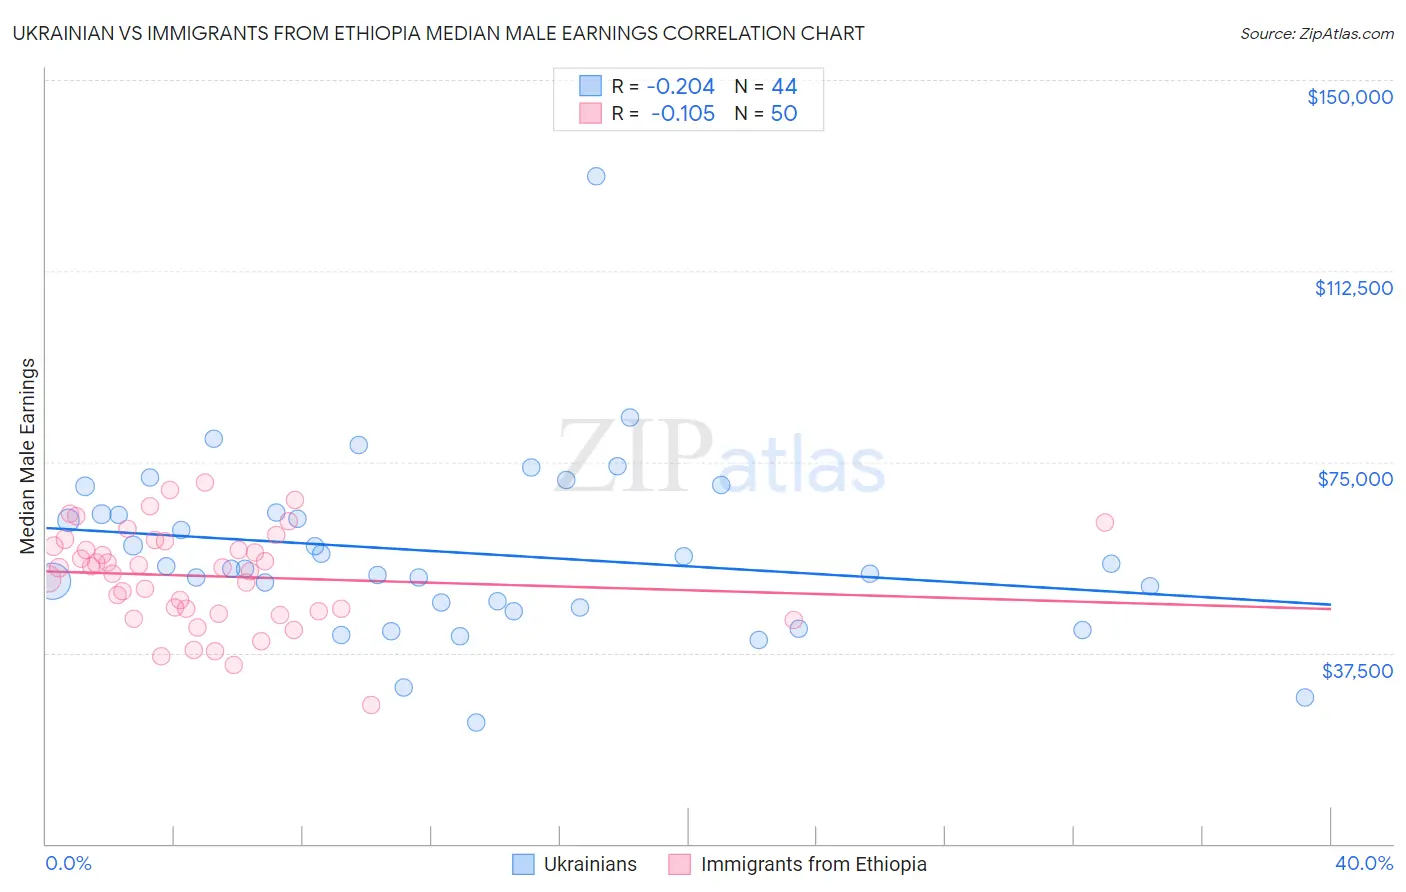
Ukrainian vs Immigrants from Ethiopia Median Male Earnings Correlation Chart
The statistical analysis conducted on geographies consisting of 448,432,137 people shows a weak negative correlation between the proportion of Ukrainians and median male earnings in the United States with a correlation coefficient (R) of -0.204 and weighted average of $59,728. Similarly, the statistical analysis conducted on geographies consisting of 211,550,468 people shows a poor negative correlation between the proportion of Immigrants from Ethiopia and median male earnings in the United States with a correlation coefficient (R) of -0.105 and weighted average of $55,434, a difference of 7.7%.
Median Male Earnings Correlation Summary
| Measurement | Ukrainian | Immigrants from Ethiopia |
| Minimum | $23,696 | $27,233 |
| Maximum | $131,091 | $70,982 |
| Range | $107,394 | $43,749 |
| Mean | $57,214 | $52,533 |
| Median | $54,259 | $54,177 |
| Interquartile 25% (IQ1) | $46,850 | $45,679 |
| Interquartile 75% (IQ3) | $64,861 | $59,341 |
| Interquartile Range (IQR) | $18,011 | $13,662 |
| Standard Deviation (Sample) | $17,751 | $9,594 |
| Standard Deviation (Population) | $17,548 | $9,497 |
Similar Demographics by Median Male Earnings
Demographics Similar to Ukrainians by Median Male Earnings
In terms of median male earnings, the demographic groups most similar to Ukrainians are Croatian ($59,715, a difference of 0.020%), Immigrants from Italy ($59,691, a difference of 0.060%), Immigrants from Hungary ($59,806, a difference of 0.13%), Immigrants from Ukraine ($59,820, a difference of 0.16%), and Afghan ($59,554, a difference of 0.29%).
| Demographics | Rating | Rank | Median Male Earnings |
| Argentineans | 99.6 /100 | #74 | Exceptional $60,117 |
| Immigrants | Bolivia | 99.6 /100 | #75 | Exceptional $60,088 |
| Romanians | 99.6 /100 | #76 | Exceptional $60,063 |
| Paraguayans | 99.5 /100 | #77 | Exceptional $59,975 |
| Immigrants | Egypt | 99.5 /100 | #78 | Exceptional $59,925 |
| Immigrants | Ukraine | 99.5 /100 | #79 | Exceptional $59,820 |
| Immigrants | Hungary | 99.5 /100 | #80 | Exceptional $59,806 |
| Ukrainians | 99.4 /100 | #81 | Exceptional $59,728 |
| Croatians | 99.4 /100 | #82 | Exceptional $59,715 |
| Immigrants | Italy | 99.4 /100 | #83 | Exceptional $59,691 |
| Afghans | 99.3 /100 | #84 | Exceptional $59,554 |
| Italians | 99.3 /100 | #85 | Exceptional $59,551 |
| Immigrants | England | 99.3 /100 | #86 | Exceptional $59,527 |
| Macedonians | 99.3 /100 | #87 | Exceptional $59,522 |
| Immigrants | Argentina | 99.3 /100 | #88 | Exceptional $59,491 |
Demographics Similar to Immigrants from Ethiopia by Median Male Earnings
In terms of median male earnings, the demographic groups most similar to Immigrants from Ethiopia are Icelander ($55,415, a difference of 0.030%), Czechoslovakian ($55,382, a difference of 0.090%), Alsatian ($55,380, a difference of 0.10%), Basque ($55,370, a difference of 0.12%), and Belgian ($55,361, a difference of 0.13%).
| Demographics | Rating | Rank | Median Male Earnings |
| English | 77.4 /100 | #149 | Good $55,747 |
| Swiss | 77.1 /100 | #150 | Good $55,731 |
| Immigrants | Oceania | 76.8 /100 | #151 | Good $55,712 |
| Peruvians | 75.8 /100 | #152 | Good $55,659 |
| Immigrants | Nepal | 75.0 /100 | #153 | Good $55,615 |
| Taiwanese | 73.9 /100 | #154 | Good $55,556 |
| Scandinavians | 73.4 /100 | #155 | Good $55,527 |
| Immigrants | Ethiopia | 71.6 /100 | #156 | Good $55,434 |
| Icelanders | 71.2 /100 | #157 | Good $55,415 |
| Czechoslovakians | 70.5 /100 | #158 | Good $55,382 |
| Alsatians | 70.5 /100 | #159 | Good $55,380 |
| Basques | 70.3 /100 | #160 | Good $55,370 |
| Belgians | 70.1 /100 | #161 | Good $55,361 |
| French | 69.9 /100 | #162 | Good $55,350 |
| Ugandans | 68.6 /100 | #163 | Good $55,290 |