Ukrainian vs Immigrants from Eastern Asia Median Earnings
COMPARE
Ukrainian
Immigrants from Eastern Asia
Median Earnings
Median Earnings Comparison
Ukrainians
Immigrants from Eastern Asia
$50,320
MEDIAN EARNINGS
99.6/ 100
METRIC RATING
80th/ 347
METRIC RANK
$56,183
MEDIAN EARNINGS
100.0/ 100
METRIC RATING
16th/ 347
METRIC RANK
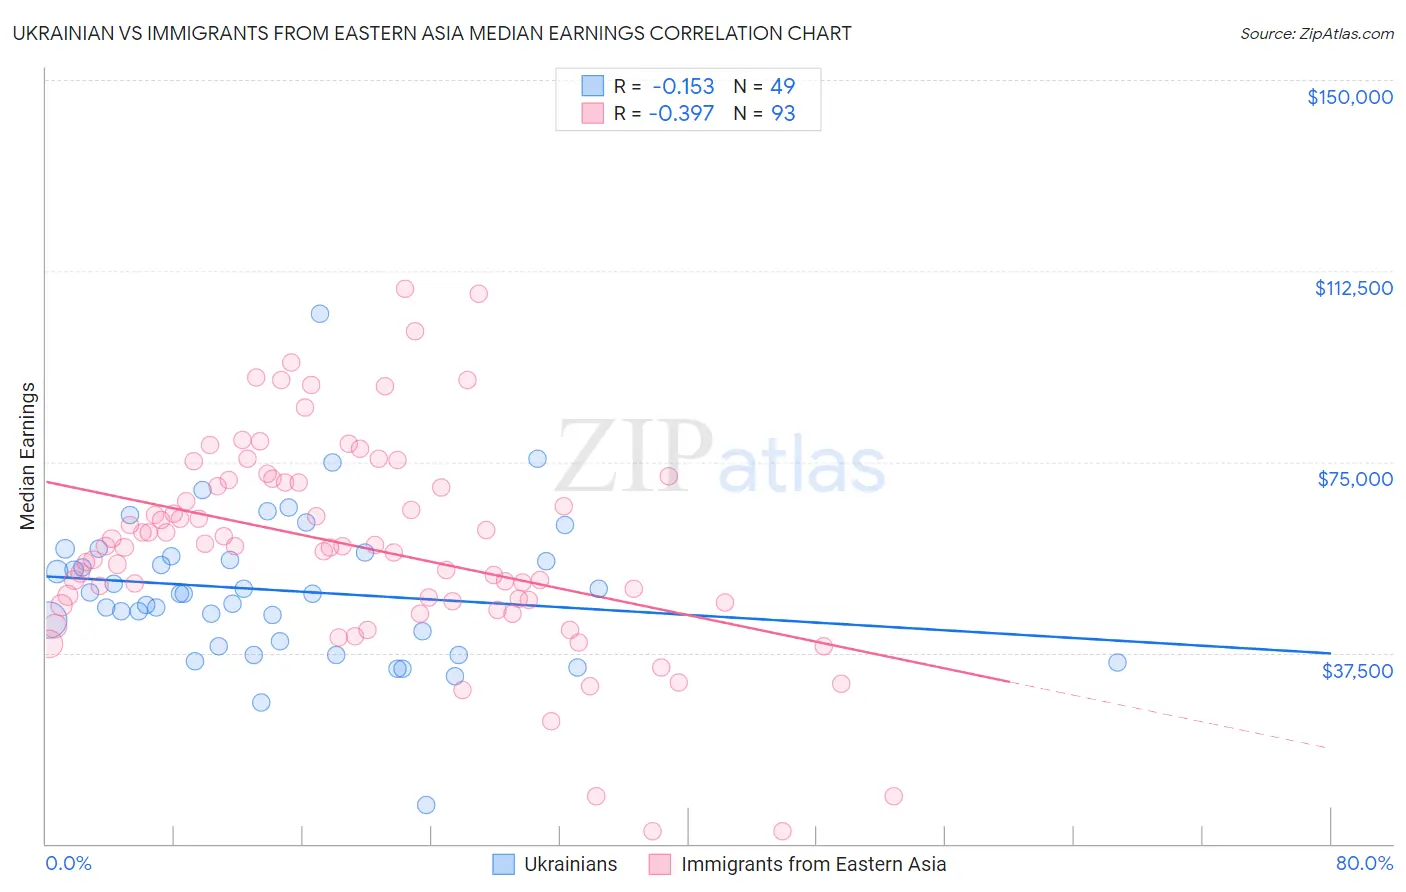
Ukrainian vs Immigrants from Eastern Asia Median Earnings Correlation Chart
The statistical analysis conducted on geographies consisting of 448,668,422 people shows a poor negative correlation between the proportion of Ukrainians and median earnings in the United States with a correlation coefficient (R) of -0.153 and weighted average of $50,320. Similarly, the statistical analysis conducted on geographies consisting of 499,910,866 people shows a mild negative correlation between the proportion of Immigrants from Eastern Asia and median earnings in the United States with a correlation coefficient (R) of -0.397 and weighted average of $56,183, a difference of 11.7%.
Median Earnings Correlation Summary
| Measurement | Ukrainian | Immigrants from Eastern Asia |
| Minimum | $7,500 | $2,499 |
| Maximum | $104,015 | $109,069 |
| Range | $96,515 | $106,570 |
| Mean | $49,735 | $58,494 |
| Median | $49,200 | $58,436 |
| Interquartile 25% (IQ1) | $39,295 | $47,510 |
| Interquartile 75% (IQ3) | $56,811 | $71,190 |
| Interquartile Range (IQR) | $17,516 | $23,680 |
| Standard Deviation (Sample) | $14,902 | $20,635 |
| Standard Deviation (Population) | $14,749 | $20,524 |
Similar Demographics by Median Earnings
Demographics Similar to Ukrainians by Median Earnings
In terms of median earnings, the demographic groups most similar to Ukrainians are Laotian ($50,343, a difference of 0.050%), Immigrants from Southern Europe ($50,280, a difference of 0.080%), Immigrants from Moldova ($50,274, a difference of 0.090%), Romanian ($50,244, a difference of 0.15%), and Argentinean ($50,399, a difference of 0.16%).
| Demographics | Rating | Rank | Median Earnings |
| Immigrants | Netherlands | 99.8 /100 | #73 | Exceptional $50,818 |
| South Africans | 99.8 /100 | #74 | Exceptional $50,752 |
| Immigrants | Scotland | 99.8 /100 | #75 | Exceptional $50,741 |
| Immigrants | Italy | 99.7 /100 | #76 | Exceptional $50,581 |
| Immigrants | Western Europe | 99.7 /100 | #77 | Exceptional $50,549 |
| Argentineans | 99.6 /100 | #78 | Exceptional $50,399 |
| Laotians | 99.6 /100 | #79 | Exceptional $50,343 |
| Ukrainians | 99.6 /100 | #80 | Exceptional $50,320 |
| Immigrants | Southern Europe | 99.6 /100 | #81 | Exceptional $50,280 |
| Immigrants | Moldova | 99.5 /100 | #82 | Exceptional $50,274 |
| Romanians | 99.5 /100 | #83 | Exceptional $50,244 |
| Immigrants | Hungary | 99.5 /100 | #84 | Exceptional $50,227 |
| Immigrants | Kazakhstan | 99.5 /100 | #85 | Exceptional $50,225 |
| Immigrants | Canada | 99.5 /100 | #86 | Exceptional $50,192 |
| Immigrants | Uzbekistan | 99.5 /100 | #87 | Exceptional $50,151 |
Demographics Similar to Immigrants from Eastern Asia by Median Earnings
In terms of median earnings, the demographic groups most similar to Immigrants from Eastern Asia are Indian (Asian) ($56,253, a difference of 0.12%), Immigrants from Australia ($56,305, a difference of 0.22%), Immigrants from China ($56,638, a difference of 0.81%), Immigrants from Ireland ($56,854, a difference of 1.2%), and Immigrants from Israel ($57,034, a difference of 1.5%).
| Demographics | Rating | Rank | Median Earnings |
| Okinawans | 100.0 /100 | #9 | Exceptional $57,550 |
| Immigrants | South Central Asia | 100.0 /100 | #10 | Exceptional $57,114 |
| Immigrants | Israel | 100.0 /100 | #11 | Exceptional $57,034 |
| Immigrants | Ireland | 100.0 /100 | #12 | Exceptional $56,854 |
| Immigrants | China | 100.0 /100 | #13 | Exceptional $56,638 |
| Immigrants | Australia | 100.0 /100 | #14 | Exceptional $56,305 |
| Indians (Asian) | 100.0 /100 | #15 | Exceptional $56,253 |
| Immigrants | Eastern Asia | 100.0 /100 | #16 | Exceptional $56,183 |
| Eastern Europeans | 100.0 /100 | #17 | Exceptional $55,084 |
| Immigrants | Japan | 100.0 /100 | #18 | Exceptional $54,938 |
| Immigrants | Belgium | 100.0 /100 | #19 | Exceptional $54,679 |
| Cypriots | 100.0 /100 | #20 | Exceptional $54,589 |
| Burmese | 100.0 /100 | #21 | Exceptional $54,559 |
| Immigrants | Korea | 100.0 /100 | #22 | Exceptional $54,530 |
| Immigrants | Sweden | 100.0 /100 | #23 | Exceptional $54,478 |