Ukrainian vs Croatian Median Female Earnings
COMPARE
Ukrainian
Croatian
Median Female Earnings
Median Female Earnings Comparison
Ukrainians
Croatians
$42,015
MEDIAN FEMALE EARNINGS
99.2/ 100
METRIC RATING
90th/ 347
METRIC RANK
$40,993
MEDIAN FEMALE EARNINGS
93.7/ 100
METRIC RATING
121st/ 347
METRIC RANK
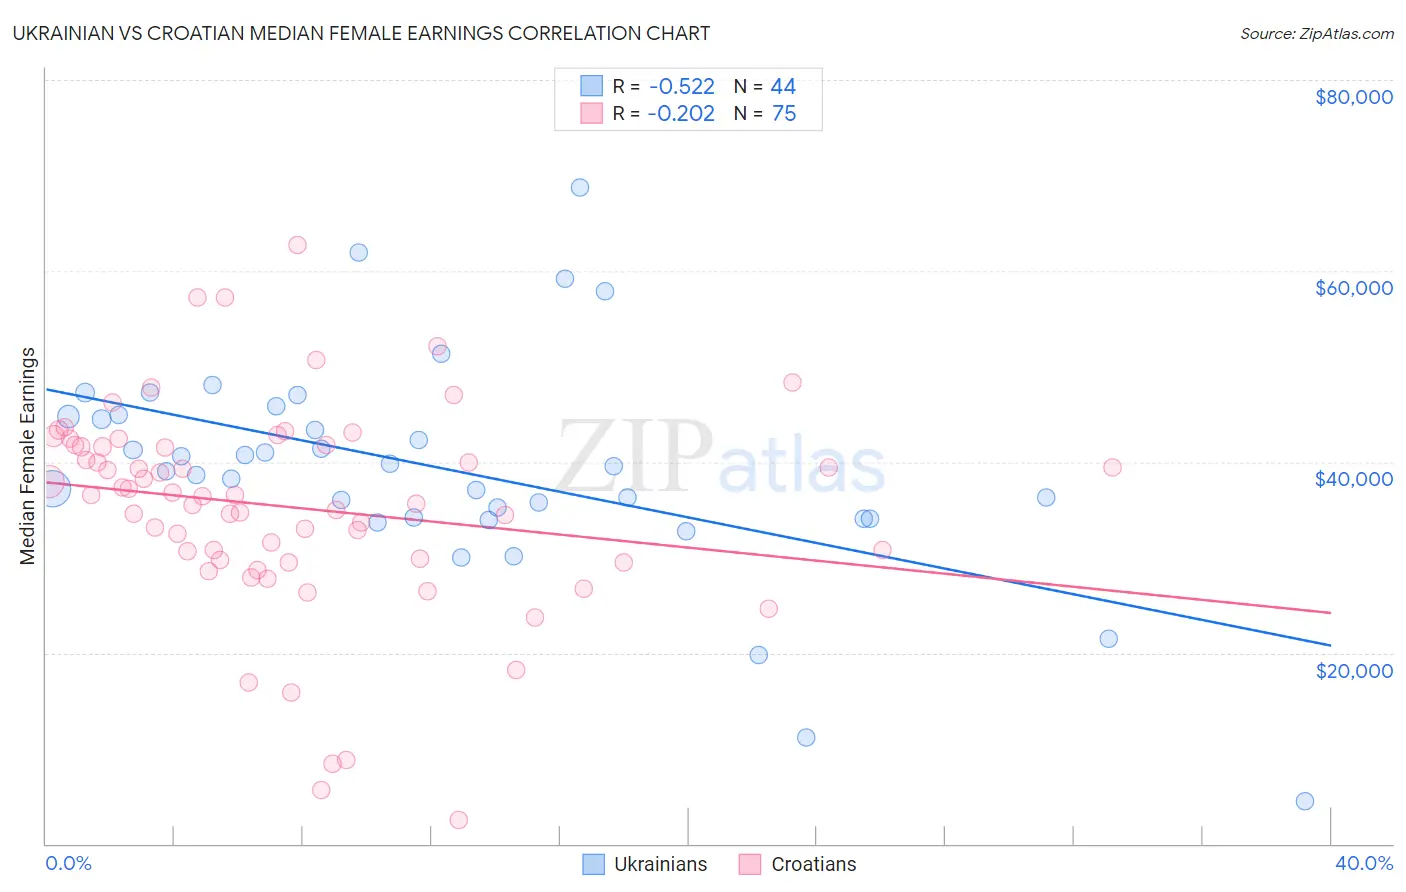
Ukrainian vs Croatian Median Female Earnings Correlation Chart
The statistical analysis conducted on geographies consisting of 448,339,242 people shows a substantial negative correlation between the proportion of Ukrainians and median female earnings in the United States with a correlation coefficient (R) of -0.522 and weighted average of $42,015. Similarly, the statistical analysis conducted on geographies consisting of 375,526,818 people shows a weak negative correlation between the proportion of Croatians and median female earnings in the United States with a correlation coefficient (R) of -0.202 and weighted average of $40,993, a difference of 2.5%.
Median Female Earnings Correlation Summary
| Measurement | Ukrainian | Croatian |
| Minimum | $4,400 | $2,499 |
| Maximum | $68,750 | $62,750 |
| Range | $64,350 | $60,251 |
| Mean | $39,267 | $35,223 |
| Median | $39,270 | $36,468 |
| Interquartile 25% (IQ1) | $34,102 | $29,748 |
| Interquartile 75% (IQ3) | $44,856 | $41,743 |
| Interquartile Range (IQR) | $10,753 | $11,995 |
| Standard Deviation (Sample) | $11,661 | $11,020 |
| Standard Deviation (Population) | $11,527 | $10,947 |
Similar Demographics by Median Female Earnings
Demographics Similar to Ukrainians by Median Female Earnings
In terms of median female earnings, the demographic groups most similar to Ukrainians are Immigrants from Western Europe ($41,990, a difference of 0.060%), Immigrants from Afghanistan ($42,055, a difference of 0.10%), Argentinean ($41,952, a difference of 0.15%), Immigrants from Northern Africa ($42,084, a difference of 0.16%), and Immigrants from Grenada ($41,932, a difference of 0.20%).
| Demographics | Rating | Rank | Median Female Earnings |
| Immigrants | Sierra Leone | 99.5 /100 | #83 | Exceptional $42,214 |
| Armenians | 99.5 /100 | #84 | Exceptional $42,212 |
| Laotians | 99.4 /100 | #85 | Exceptional $42,133 |
| Immigrants | St. Vincent and the Grenadines | 99.3 /100 | #86 | Exceptional $42,108 |
| Lithuanians | 99.3 /100 | #87 | Exceptional $42,108 |
| Immigrants | Northern Africa | 99.3 /100 | #88 | Exceptional $42,084 |
| Immigrants | Afghanistan | 99.3 /100 | #89 | Exceptional $42,055 |
| Ukrainians | 99.2 /100 | #90 | Exceptional $42,015 |
| Immigrants | Western Europe | 99.2 /100 | #91 | Exceptional $41,990 |
| Argentineans | 99.1 /100 | #92 | Exceptional $41,952 |
| Immigrants | Grenada | 99.0 /100 | #93 | Exceptional $41,932 |
| Moroccans | 98.9 /100 | #94 | Exceptional $41,872 |
| Immigrants | Netherlands | 98.9 /100 | #95 | Exceptional $41,870 |
| South Africans | 98.8 /100 | #96 | Exceptional $41,825 |
| Immigrants | Hungary | 98.8 /100 | #97 | Exceptional $41,820 |
Demographics Similar to Croatians by Median Female Earnings
In terms of median female earnings, the demographic groups most similar to Croatians are Immigrants from Jordan ($40,977, a difference of 0.040%), Guyanese ($40,973, a difference of 0.050%), Trinidadian and Tobagonian ($40,958, a difference of 0.090%), Immigrants from Kuwait ($41,055, a difference of 0.15%), and Austrian ($40,923, a difference of 0.17%).
| Demographics | Rating | Rank | Median Female Earnings |
| Immigrants | England | 96.4 /100 | #114 | Exceptional $41,277 |
| Koreans | 96.4 /100 | #115 | Exceptional $41,276 |
| Immigrants | Brazil | 96.4 /100 | #116 | Exceptional $41,273 |
| Barbadians | 96.3 /100 | #117 | Exceptional $41,261 |
| Immigrants | Lebanon | 95.6 /100 | #118 | Exceptional $41,183 |
| Immigrants | Philippines | 95.0 /100 | #119 | Exceptional $41,114 |
| Immigrants | Kuwait | 94.4 /100 | #120 | Exceptional $41,055 |
| Croatians | 93.7 /100 | #121 | Exceptional $40,993 |
| Immigrants | Jordan | 93.5 /100 | #122 | Exceptional $40,977 |
| Guyanese | 93.4 /100 | #123 | Exceptional $40,973 |
| Trinidadians and Tobagonians | 93.2 /100 | #124 | Exceptional $40,958 |
| Austrians | 92.7 /100 | #125 | Exceptional $40,923 |
| Immigrants | Trinidad and Tobago | 92.3 /100 | #126 | Exceptional $40,895 |
| Ugandans | 92.2 /100 | #127 | Exceptional $40,889 |
| Carpatho Rusyns | 91.2 /100 | #128 | Exceptional $40,825 |