Ukrainian vs Carpatho Rusyn Median Family Income
COMPARE
Ukrainian
Carpatho Rusyn
Median Family Income
Median Family Income Comparison
Ukrainians
Carpatho Rusyns
$111,368
MEDIAN FAMILY INCOME
98.8/ 100
METRIC RATING
86th/ 347
METRIC RANK
$107,502
MEDIAN FAMILY INCOME
92.2/ 100
METRIC RATING
123rd/ 347
METRIC RANK
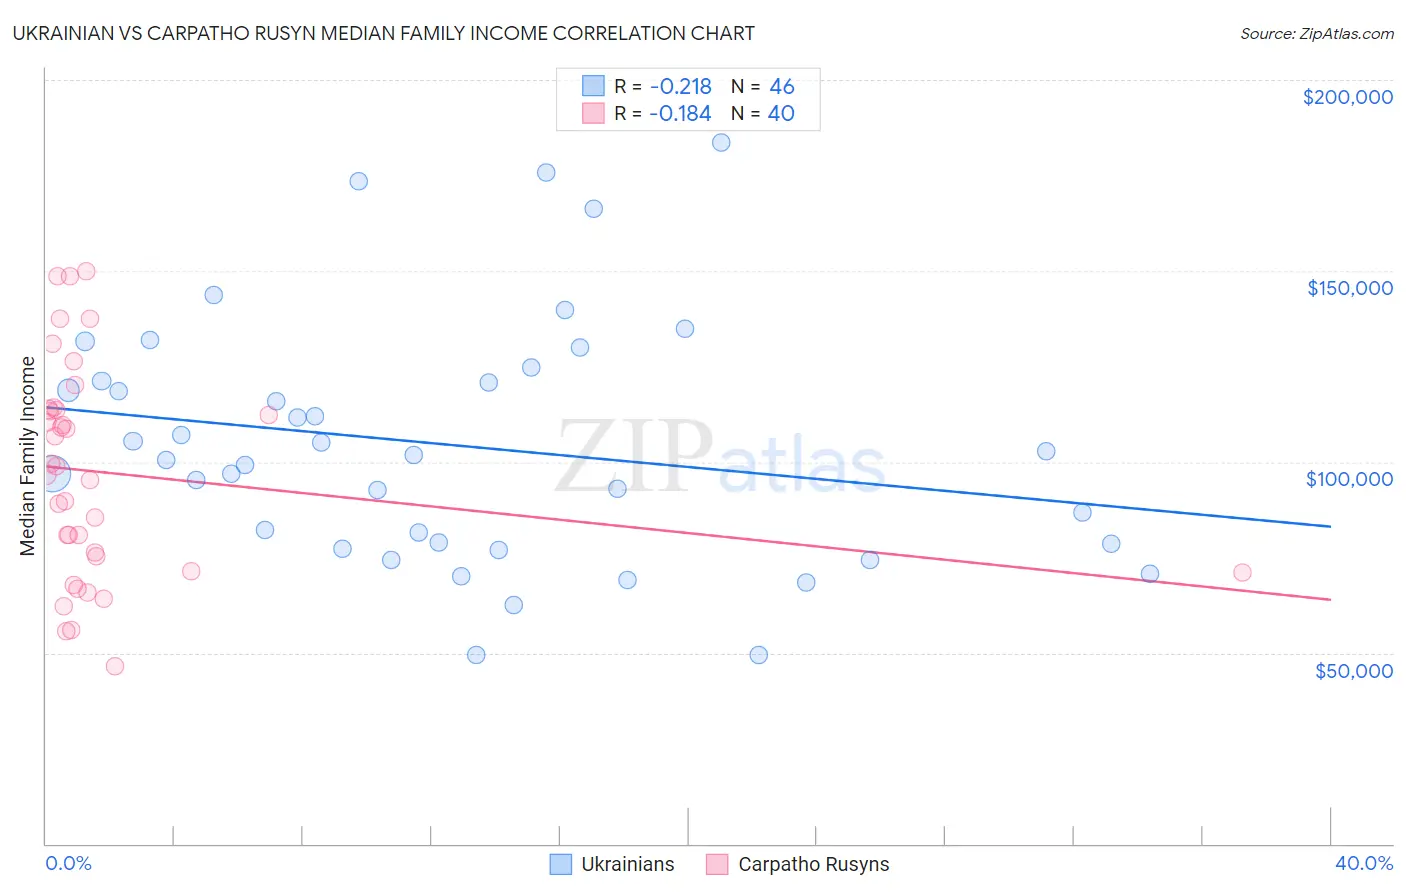
Ukrainian vs Carpatho Rusyn Median Family Income Correlation Chart
The statistical analysis conducted on geographies consisting of 448,126,657 people shows a weak negative correlation between the proportion of Ukrainians and median family income in the United States with a correlation coefficient (R) of -0.218 and weighted average of $111,368. Similarly, the statistical analysis conducted on geographies consisting of 58,866,021 people shows a poor negative correlation between the proportion of Carpatho Rusyns and median family income in the United States with a correlation coefficient (R) of -0.184 and weighted average of $107,502, a difference of 3.6%.
Median Family Income Correlation Summary
| Measurement | Ukrainian | Carpatho Rusyn |
| Minimum | $49,418 | $46,375 |
| Maximum | $183,477 | $150,052 |
| Range | $134,059 | $103,677 |
| Mean | $104,354 | $97,160 |
| Median | $101,148 | $97,813 |
| Interquartile 25% (IQ1) | $78,581 | $73,203 |
| Interquartile 75% (IQ3) | $121,262 | $113,650 |
| Interquartile Range (IQR) | $42,681 | $40,447 |
| Standard Deviation (Sample) | $32,156 | $27,905 |
| Standard Deviation (Population) | $31,804 | $27,554 |
Similar Demographics by Median Family Income
Demographics Similar to Ukrainians by Median Family Income
In terms of median family income, the demographic groups most similar to Ukrainians are Croatian ($111,370, a difference of 0.0%), Immigrants from Hungary ($111,378, a difference of 0.010%), Austrian ($111,306, a difference of 0.060%), Romanian ($111,243, a difference of 0.11%), and Immigrants from Egypt ($111,689, a difference of 0.29%).
| Demographics | Rating | Rank | Median Family Income |
| Italians | 99.3 /100 | #79 | Exceptional $112,372 |
| Immigrants | Croatia | 99.3 /100 | #80 | Exceptional $112,323 |
| Immigrants | North America | 99.2 /100 | #81 | Exceptional $112,151 |
| Immigrants | England | 99.2 /100 | #82 | Exceptional $112,038 |
| Immigrants | Egypt | 99.0 /100 | #83 | Exceptional $111,689 |
| Immigrants | Hungary | 98.8 /100 | #84 | Exceptional $111,378 |
| Croatians | 98.8 /100 | #85 | Exceptional $111,370 |
| Ukrainians | 98.8 /100 | #86 | Exceptional $111,368 |
| Austrians | 98.8 /100 | #87 | Exceptional $111,306 |
| Romanians | 98.8 /100 | #88 | Exceptional $111,243 |
| Immigrants | Argentina | 98.5 /100 | #89 | Exceptional $110,873 |
| Northern Europeans | 98.3 /100 | #90 | Exceptional $110,635 |
| Immigrants | Southern Europe | 98.3 /100 | #91 | Exceptional $110,614 |
| Immigrants | Lebanon | 97.9 /100 | #92 | Exceptional $110,159 |
| Immigrants | Kazakhstan | 97.8 /100 | #93 | Exceptional $110,137 |
Demographics Similar to Carpatho Rusyns by Median Family Income
In terms of median family income, the demographic groups most similar to Carpatho Rusyns are Pakistani ($107,390, a difference of 0.11%), Taiwanese ($107,295, a difference of 0.19%), Immigrants from Jordan ($107,715, a difference of 0.20%), Serbian ($107,157, a difference of 0.32%), and Lebanese ($107,086, a difference of 0.39%).
| Demographics | Rating | Rank | Median Family Income |
| Chileans | 95.0 /100 | #116 | Exceptional $108,429 |
| Immigrants | Philippines | 94.6 /100 | #117 | Exceptional $108,288 |
| Ethiopians | 94.5 /100 | #118 | Exceptional $108,251 |
| Sri Lankans | 94.5 /100 | #119 | Exceptional $108,234 |
| Immigrants | Northern Africa | 94.3 /100 | #120 | Exceptional $108,161 |
| Europeans | 94.1 /100 | #121 | Exceptional $108,099 |
| Immigrants | Jordan | 92.9 /100 | #122 | Exceptional $107,715 |
| Carpatho Rusyns | 92.2 /100 | #123 | Exceptional $107,502 |
| Pakistanis | 91.7 /100 | #124 | Exceptional $107,390 |
| Taiwanese | 91.4 /100 | #125 | Exceptional $107,295 |
| Serbians | 90.8 /100 | #126 | Exceptional $107,157 |
| Lebanese | 90.5 /100 | #127 | Exceptional $107,086 |
| Immigrants | Ethiopia | 90.0 /100 | #128 | Excellent $106,969 |
| Arabs | 89.9 /100 | #129 | Excellent $106,952 |
| Brazilians | 89.8 /100 | #130 | Excellent $106,942 |