Trinidadian and Tobagonian vs Macedonian Householder Income Over 65 years

COMPARE

Trinidadian and Tobagonian
Race
Ancestry
AfghanAfricanAlaska NativeAlaskan AthabascanAlbanianAleutAlsatianAmericanApacheArabArapahoArgentineanArmenianAssyrian/Chaldean/SyriacAustralianAustrianBahamianBangladeshiBarbadianBasqueBelgianBelizeanBermudanBhutaneseBlackfeetBolivianBrazilianBritishBritish West IndianBulgarianBurmeseCajunCambodianCanadianCape VerdeanCarpatho RusynCelticCentral AmericanCentral American IndianCherokeeCheyenneChickasawChileanChineseChippewaChoctawColombianColvilleComancheCosta RicanCreeCreekCroatianCrowCubanCypriotCzechCzechoslovakianDanishDelawareDominicanDutchDutch West IndianEastern EuropeanEcuadorianEgyptianEnglishEstonianEthiopianEuropeanFijianFilipinoFinnishFrenchFrench American IndianFrench CanadianGermanGerman RussianGhanaianGreekGuamanian/ChamorroGuatemalanGuyaneseHaitianHmongHonduranHopiHoumaHungarianIcelanderIndian (Asian)IndonesianInupiatIranianIraqiIrishIroquoisIsraeliItalianJamaicanJapaneseJordanianKenyanKiowaKoreanLaotianLatvianLebaneseLiberianLithuanianLumbeeLuxembourgerMalaysianMalteseMarshalleseMenomineeMexicanMexican American IndianMongolianMoroccanNative HawaiianNavajoNepaleseNew ZealanderNicaraguanNigerianNorthern EuropeanNorwegianOkinawanOsageOttawaPaiutePakistaniPalestinianPanamanianParaguayanPennsylvania GermanPeruvianPimaPolishPortuguesePotawatomiPuebloPuerto RicanPuget Sound SalishRomanianRussianSalvadoranSamoanScandinavianScotch-IrishScottishSeminoleSenegaleseSerbianShoshoneSierra LeoneanSiouxSlavicSlovakSloveneSomaliSouth AfricanSouth AmericanSouth American IndianSoviet UnionSpaniardSpanishSpanish AmericanSpanish American IndianSri LankanSubsaharan AfricanSudaneseSwedishSwissSyrianTaiwaneseThaiTlingit-HaidaTohono O'OdhamTonganTrinidadian and TobagonianTsimshianTurkishU.S. Virgin IslanderUgandanUkrainianUruguayanUteVenezuelanVietnameseWelshWest IndianYakamaYaquiYugoslavianYumanYup'ikZimbabwean
Immigration
NonimmigrantsImmigrantsAfghanistanAfricaAlbaniaArgentinaArmeniaAsiaAustraliaAustriaBahamasBangladeshBarbadosBelarusBelgiumBelizeBoliviaBosnia and HerzegovinaBrazilBulgariaBurma/MyanmarCabo VerdeCambodiaCameroonCanadaCaribbeanCentral AmericaChileChinaColombiaCongoCosta RicaCroatiaCubaCzechoslovakiaDenmarkDominicaDominican RepublicEastern AfricaEastern AsiaEastern EuropeEcuadorEgyptEl SalvadorEnglandEritreaEthiopiaEuropeFijiFranceGermanyGhanaGreeceGrenadaGuatemalaGuyanaHaitiHondurasHong KongHungaryIndiaIndonesiaIranIraqIrelandIsraelItalyJamaicaJapanJordanKazakhstanKenyaKoreaKuwaitLaosLatin AmericaLatviaLebanonLiberiaLithuaniaMalaysiaMexicoMicronesiaMiddle AfricaMoldovaMoroccoNepalNetherlandsNicaraguaNigeriaNorth AmericaNorth MacedoniaNorthern AfricaNorthern EuropeNorwayOceaniaPakistanPanamaPeruPhilippinesPolandPortugalRomaniaRussiaSaudi ArabiaScotlandSenegalSerbiaSierra LeoneSingaporeSomaliaSouth AfricaSouth AmericaSouth Central AsiaSouth Eastern AsiaSouthern EuropeSpainSri LankaSt. Vincent and the GrenadinesSudanSwedenSwitzerlandSyriaTaiwanThailandTrinidad and TobagoTurkeyUgandaUkraineUruguayUzbekistanVenezuelaVietnamWest IndiesWestern AfricaWestern AsiaWestern EuropeYemenZaireZimbabweAzores
Macedonian
Race
Ancestry
AfghanAfricanAlaska NativeAlaskan AthabascanAlbanianAleutAlsatianAmericanApacheArabArapahoArgentineanArmenianAssyrian/Chaldean/SyriacAustralianAustrianBahamianBangladeshiBarbadianBasqueBelgianBelizeanBermudanBhutaneseBlackfeetBolivianBrazilianBritishBritish West IndianBulgarianBurmeseCajunCambodianCanadianCape VerdeanCarpatho RusynCelticCentral AmericanCentral American IndianCherokeeCheyenneChickasawChileanChineseChippewaChoctawColombianColvilleComancheCosta RicanCreeCreekCroatianCrowCubanCypriotCzechCzechoslovakianDanishDelawareDominicanDutchDutch West IndianEastern EuropeanEcuadorianEgyptianEnglishEstonianEthiopianEuropeanFijianFilipinoFinnishFrenchFrench American IndianFrench CanadianGermanGerman RussianGhanaianGreekGuamanian/ChamorroGuatemalanGuyaneseHaitianHmongHonduranHopiHoumaHungarianIcelanderIndian (Asian)IndonesianInupiatIranianIraqiIrishIroquoisIsraeliItalianJamaicanJapaneseJordanianKenyanKiowaKoreanLaotianLatvianLebaneseLiberianLithuanianLumbeeLuxembourgerMacedonianMalaysianMalteseMarshalleseMenomineeMexicanMexican American IndianMongolianMoroccanNative HawaiianNavajoNepaleseNew ZealanderNicaraguanNigerianNorthern EuropeanNorwegianOkinawanOsageOttawaPaiutePakistaniPalestinianPanamanianParaguayanPennsylvania GermanPeruvianPimaPolishPortuguesePotawatomiPuebloPuerto RicanPuget Sound SalishRomanianRussianSalvadoranSamoanScandinavianScotch-IrishScottishSeminoleSenegaleseSerbianShoshoneSierra LeoneanSiouxSlavicSlovakSloveneSomaliSouth AfricanSouth AmericanSouth American IndianSoviet UnionSpaniardSpanishSpanish AmericanSpanish American IndianSri LankanSubsaharan AfricanSudaneseSwedishSwissSyrianTaiwaneseThaiTlingit-HaidaTohono O'OdhamTonganTsimshianTurkishU.S. Virgin IslanderUgandanUkrainianUruguayanUteVenezuelanVietnameseWelshWest IndianYakamaYaquiYugoslavianYumanYup'ikZimbabwean
Immigration
NonimmigrantsImmigrantsAfghanistanAfricaAlbaniaArgentinaArmeniaAsiaAustraliaAustriaBahamasBangladeshBarbadosBelarusBelgiumBelizeBoliviaBosnia and HerzegovinaBrazilBulgariaBurma/MyanmarCabo VerdeCambodiaCameroonCanadaCaribbeanCentral AmericaChileChinaColombiaCongoCosta RicaCroatiaCubaCzechoslovakiaDenmarkDominicaDominican RepublicEastern AfricaEastern AsiaEastern EuropeEcuadorEgyptEl SalvadorEnglandEritreaEthiopiaEuropeFijiFranceGermanyGhanaGreeceGrenadaGuatemalaGuyanaHaitiHondurasHong KongHungaryIndiaIndonesiaIranIraqIrelandIsraelItalyJamaicaJapanJordanKazakhstanKenyaKoreaKuwaitLaosLatin AmericaLatviaLebanonLiberiaLithuaniaMalaysiaMexicoMicronesiaMiddle AfricaMoldovaMoroccoNepalNetherlandsNicaraguaNigeriaNorth AmericaNorth MacedoniaNorthern AfricaNorthern EuropeNorwayOceaniaPakistanPanamaPeruPhilippinesPolandPortugalRomaniaRussiaSaudi ArabiaScotlandSenegalSerbiaSierra LeoneSingaporeSomaliaSouth AfricaSouth AmericaSouth Central AsiaSouth Eastern AsiaSouthern EuropeSpainSri LankaSt. Vincent and the GrenadinesSudanSwedenSwitzerlandSyriaTaiwanThailandTrinidad and TobagoTurkeyUgandaUkraineUruguayUzbekistanVenezuelaVietnamWest IndiesWestern AfricaWestern AsiaWestern EuropeYemenZaireZimbabweAzores
Householder Income Over 65 years
Income
Poverty
Unemployment
Labor Participation
Family Structure
Vehicle Availability
Education Level
Disability

Householder Income Over 65 years Comparison

Trinidadians and Tobagonians

Macedonians

Tragic
Good
$55,327
HOUSEHOLDER INCOME OVER 65 YEARS
0.3/ 100
METRIC RATING
257th/ 347
METRIC RANK
$61,564
HOUSEHOLDER INCOME OVER 65 YEARS
65.1/ 100
METRIC RATING
157th/ 347
METRIC RANK

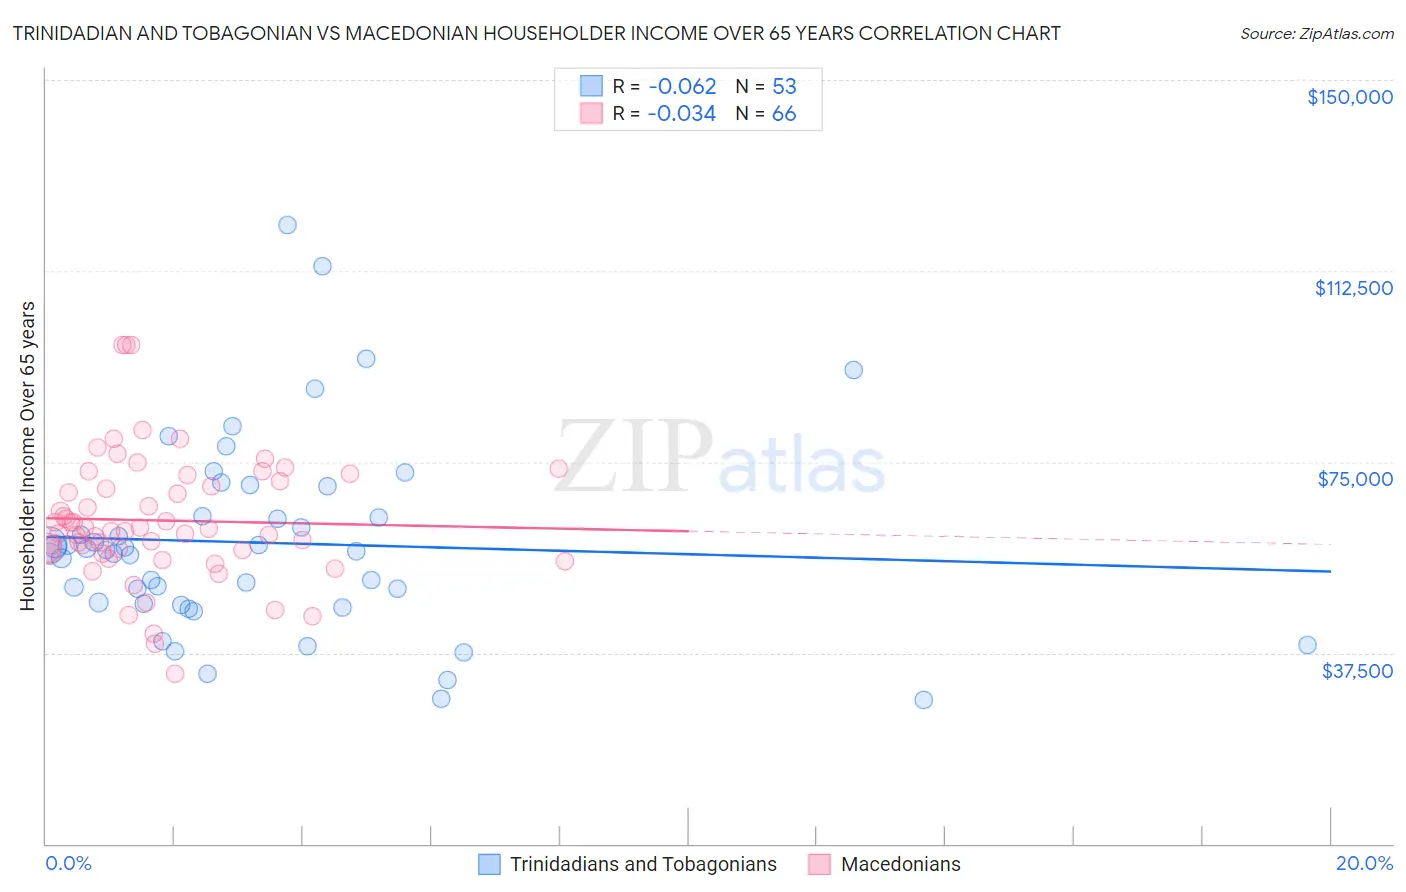
Trinidadian and Tobagonian vs Macedonian Householder Income Over 65 years Correlation Chart

The statistical analysis conducted on geographies consisting of 219,266,314 people shows a slight negative correlation between the proportion of Trinidadians and Tobagonians and household income with householder over the age of 65 in the United States with a correlation coefficient (R) of -0.062 and weighted average of $55,327. Similarly, the statistical analysis conducted on geographies consisting of 132,472,355 people shows no correlation between the proportion of Macedonians and household income with householder over the age of 65 in the United States with a correlation coefficient (R) of -0.034 and weighted average of $61,564, a difference of 11.3%.
Trinidadian and Tobagonian vs Macedonian Householder Income Over 65 years

Householder Income Over 65 years Correlation Summary

MeasurementTrinidadian and TobagonianMacedonian
Minimum$28,152$33,462
Maximum$121,597$98,027
Range$93,445$64,565
Mean$59,094$63,494
Median$57,745$61,728
Interquartile 25% (IQ1)$46,990$57,018
Interquartile 75% (IQ3)$67,305$71,201
Interquartile Range (IQR)$20,315$14,184
Standard Deviation (Sample)$19,236$12,480
Standard Deviation (Population)$19,054$12,385

Similar Demographics by Householder Income Over 65 years

Demographics Similar to Trinidadians and Tobagonians by Householder Income Over 65 years

In terms of householder income over 65 years, the demographic groups most similar to Trinidadians and Tobagonians are German Russian ($55,356, a difference of 0.050%), Immigrants from Bangladesh ($55,394, a difference of 0.12%), American ($55,527, a difference of 0.36%), Immigrants from Trinidad and Tobago ($55,598, a difference of 0.49%), and Osage ($55,677, a difference of 0.63%).
DemographicsRating | RankHouseholder Income Over 65 years
Immigrants | Bosnia and Herzegovina
0.5
/100
|
#250
Tragic
$55,986
Immigrants | Portugal
0.5
/100
|
#251
Tragic
$55,924
Osage
0.4
/100
|
#252
Tragic
$55,677
Immigrants | Trinidad and Tobago
0.4
/100
|
#253
Tragic
$55,598
Americans
0.3
/100
|
#254
Tragic
$55,527
Immigrants | Bangladesh
0.3
/100
|
#255
Tragic
$55,394
German Russians
0.3
/100
|
#256
Tragic
$55,356
Trinidadians and Tobagonians
0.3
/100
|
#257
Tragic
$55,327
Ecuadorians
0.2
/100
|
#258
Tragic
$54,958
West Indians
0.2
/100
|
#259
Tragic
$54,936
Immigrants | West Indies
0.2
/100
|
#260
Tragic
$54,927
Comanche
0.2
/100
|
#261
Tragic
$54,922
Bangladeshis
0.1
/100
|
#262
Tragic
$54,719
French American Indians
0.1
/100
|
#263
Tragic
$54,699
Apache
0.1
/100
|
#264
Tragic
$54,668

Demographics Similar to Macedonians by Householder Income Over 65 years

In terms of householder income over 65 years, the demographic groups most similar to Macedonians are Scandinavian ($61,586, a difference of 0.040%), Polish ($61,598, a difference of 0.060%), Swiss ($61,621, a difference of 0.090%), Costa Rican ($61,638, a difference of 0.12%), and English ($61,487, a difference of 0.13%).
DemographicsRating | RankHouseholder Income Over 65 years
Slavs
68.5
/100
|
#150
Good
$61,709
Hungarians
67.7
/100
|
#151
Good
$61,673
Armenians
67.3
/100
|
#152
Good
$61,656
Costa Ricans
66.9
/100
|
#153
Good
$61,638
Swiss
66.5
/100
|
#154
Good
$61,621
Poles
65.9
/100
|
#155
Good
$61,598
Scandinavians
65.6
/100
|
#156
Good
$61,586
Macedonians
65.1
/100
|
#157
Good
$61,564
English
63.3
/100
|
#158
Good
$61,487
Brazilians
62.7
/100
|
#159
Good
$61,465
Portuguese
62.1
/100
|
#160
Good
$61,440
Icelanders
57.9
/100
|
#161
Average
$61,270
Czechs
57.2
/100
|
#162
Average
$61,244
Ugandans
55.5
/100
|
#163
Average
$61,177
Immigrants | North Macedonia
55.4
/100
|
#164
Average
$61,175