Trinidadian and Tobagonian vs Dutch West Indian Median Male Earnings
COMPARE
Trinidadian and Tobagonian
Dutch West Indian
Median Male Earnings
Median Male Earnings Comparison
Trinidadians and Tobagonians
Dutch West Indians
$51,446
MEDIAN MALE EARNINGS
4.8/ 100
METRIC RATING
227th/ 347
METRIC RANK
$46,656
MEDIAN MALE EARNINGS
0.0/ 100
METRIC RATING
306th/ 347
METRIC RANK
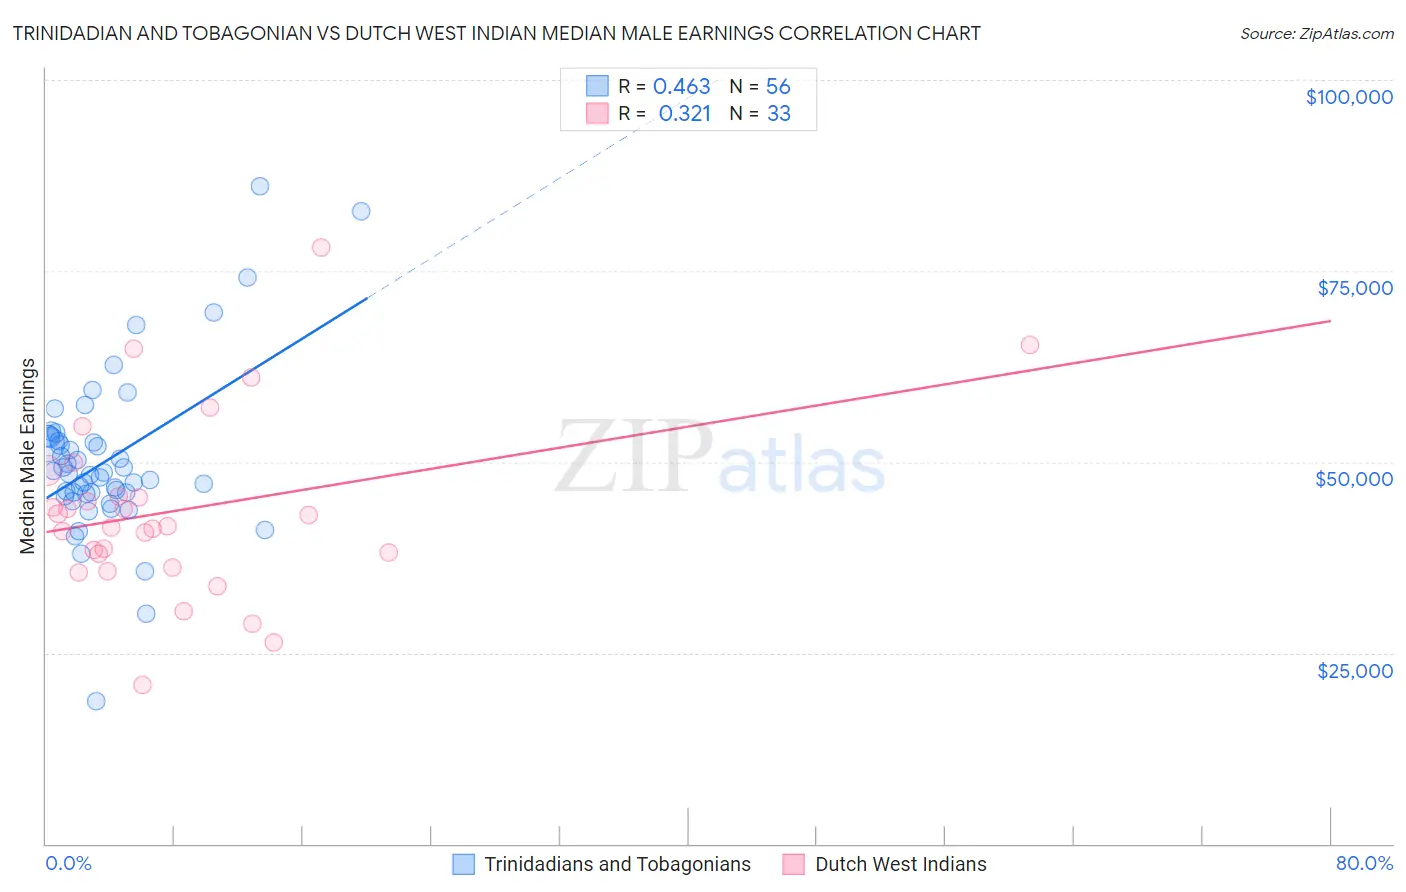
Trinidadian and Tobagonian vs Dutch West Indian Median Male Earnings Correlation Chart
The statistical analysis conducted on geographies consisting of 219,852,286 people shows a moderate positive correlation between the proportion of Trinidadians and Tobagonians and median male earnings in the United States with a correlation coefficient (R) of 0.463 and weighted average of $51,446. Similarly, the statistical analysis conducted on geographies consisting of 85,752,443 people shows a mild positive correlation between the proportion of Dutch West Indians and median male earnings in the United States with a correlation coefficient (R) of 0.321 and weighted average of $46,656, a difference of 10.3%.
Median Male Earnings Correlation Summary
| Measurement | Trinidadian and Tobagonian | Dutch West Indian |
| Minimum | $18,666 | $20,833 |
| Maximum | $86,046 | $78,036 |
| Range | $67,380 | $57,203 |
| Mean | $50,279 | $43,636 |
| Median | $48,562 | $41,596 |
| Interquartile 25% (IQ1) | $45,885 | $37,034 |
| Interquartile 75% (IQ3) | $52,942 | $47,172 |
| Interquartile Range (IQR) | $7,058 | $10,138 |
| Standard Deviation (Sample) | $10,888 | $11,759 |
| Standard Deviation (Population) | $10,790 | $11,579 |
Similar Demographics by Median Male Earnings
Demographics Similar to Trinidadians and Tobagonians by Median Male Earnings
In terms of median male earnings, the demographic groups most similar to Trinidadians and Tobagonians are Japanese ($51,473, a difference of 0.050%), Immigrants from Sudan ($51,489, a difference of 0.080%), Samoan ($51,389, a difference of 0.11%), Immigrants from Trinidad and Tobago ($51,376, a difference of 0.14%), and Immigrants from Nigeria ($51,310, a difference of 0.27%).
| Demographics | Rating | Rank | Median Male Earnings |
| Immigrants | Armenia | 6.6 /100 | #220 | Tragic $51,793 |
| Immigrants | Senegal | 5.8 /100 | #221 | Tragic $51,647 |
| Immigrants | Bangladesh | 5.8 /100 | #222 | Tragic $51,642 |
| Ecuadorians | 5.5 /100 | #223 | Tragic $51,596 |
| Immigrants | Cambodia | 5.5 /100 | #224 | Tragic $51,594 |
| Immigrants | Sudan | 5.0 /100 | #225 | Tragic $51,489 |
| Japanese | 4.9 /100 | #226 | Tragic $51,473 |
| Trinidadians and Tobagonians | 4.8 /100 | #227 | Tragic $51,446 |
| Samoans | 4.6 /100 | #228 | Tragic $51,389 |
| Immigrants | Trinidad and Tobago | 4.5 /100 | #229 | Tragic $51,376 |
| Immigrants | Nigeria | 4.2 /100 | #230 | Tragic $51,310 |
| Barbadians | 3.9 /100 | #231 | Tragic $51,236 |
| Sudanese | 3.9 /100 | #232 | Tragic $51,216 |
| Aleuts | 3.7 /100 | #233 | Tragic $51,168 |
| Cape Verdeans | 3.5 /100 | #234 | Tragic $51,103 |
Demographics Similar to Dutch West Indians by Median Male Earnings
In terms of median male earnings, the demographic groups most similar to Dutch West Indians are Immigrants from Dominican Republic ($46,655, a difference of 0.0%), Ottawa ($46,611, a difference of 0.10%), Creek ($46,594, a difference of 0.13%), Cuban ($46,580, a difference of 0.16%), and Guatemalan ($46,736, a difference of 0.17%).
| Demographics | Rating | Rank | Median Male Earnings |
| Immigrants | Zaire | 0.1 /100 | #299 | Tragic $47,070 |
| U.S. Virgin Islanders | 0.1 /100 | #300 | Tragic $47,066 |
| Immigrants | Latin America | 0.1 /100 | #301 | Tragic $46,941 |
| Seminole | 0.1 /100 | #302 | Tragic $46,783 |
| Yaqui | 0.1 /100 | #303 | Tragic $46,777 |
| Bangladeshis | 0.1 /100 | #304 | Tragic $46,744 |
| Guatemalans | 0.0 /100 | #305 | Tragic $46,736 |
| Dutch West Indians | 0.0 /100 | #306 | Tragic $46,656 |
| Immigrants | Dominican Republic | 0.0 /100 | #307 | Tragic $46,655 |
| Ottawa | 0.0 /100 | #308 | Tragic $46,611 |
| Creek | 0.0 /100 | #309 | Tragic $46,594 |
| Cubans | 0.0 /100 | #310 | Tragic $46,580 |
| Apache | 0.0 /100 | #311 | Tragic $46,429 |
| Hispanics or Latinos | 0.0 /100 | #312 | Tragic $46,419 |
| Hondurans | 0.0 /100 | #313 | Tragic $46,374 |