Tongan vs Ugandan Median Household Income

COMPARE

Tongan
Race
Ancestry
AfghanAfricanAlaska NativeAlaskan AthabascanAlbanianAleutAlsatianAmericanApacheArabArapahoArgentineanArmenianAssyrian/Chaldean/SyriacAustralianAustrianBahamianBangladeshiBarbadianBasqueBelgianBelizeanBermudanBhutaneseBlackfeetBolivianBrazilianBritishBritish West IndianBulgarianBurmeseCajunCambodianCanadianCape VerdeanCarpatho RusynCelticCentral AmericanCentral American IndianCherokeeCheyenneChickasawChileanChineseChippewaChoctawColombianColvilleComancheCosta RicanCreeCreekCroatianCrowCubanCypriotCzechCzechoslovakianDanishDelawareDominicanDutchDutch West IndianEastern EuropeanEcuadorianEgyptianEnglishEstonianEthiopianEuropeanFijianFilipinoFinnishFrenchFrench American IndianFrench CanadianGermanGerman RussianGhanaianGreekGuamanian/ChamorroGuatemalanGuyaneseHaitianHmongHonduranHopiHoumaHungarianIcelanderIndian (Asian)IndonesianInupiatIranianIraqiIrishIroquoisIsraeliItalianJamaicanJapaneseJordanianKenyanKiowaKoreanLaotianLatvianLebaneseLiberianLithuanianLumbeeLuxembourgerMacedonianMalaysianMalteseMarshalleseMenomineeMexicanMexican American IndianMongolianMoroccanNative HawaiianNavajoNepaleseNew ZealanderNicaraguanNigerianNorthern EuropeanNorwegianOkinawanOsageOttawaPaiutePakistaniPalestinianPanamanianParaguayanPennsylvania GermanPeruvianPimaPolishPortuguesePotawatomiPuebloPuerto RicanPuget Sound SalishRomanianRussianSalvadoranSamoanScandinavianScotch-IrishScottishSeminoleSenegaleseSerbianShoshoneSierra LeoneanSiouxSlavicSlovakSloveneSomaliSouth AfricanSouth AmericanSouth American IndianSoviet UnionSpaniardSpanishSpanish AmericanSpanish American IndianSri LankanSubsaharan AfricanSudaneseSwedishSwissSyrianTaiwaneseThaiTlingit-HaidaTohono O'OdhamTonganTrinidadian and TobagonianTsimshianTurkishU.S. Virgin IslanderUkrainianUruguayanUteVenezuelanVietnameseWelshWest IndianYakamaYaquiYugoslavianYumanYup'ikZimbabwean
Immigration
NonimmigrantsImmigrantsAfghanistanAfricaAlbaniaArgentinaArmeniaAsiaAustraliaAustriaBahamasBangladeshBarbadosBelarusBelgiumBelizeBoliviaBosnia and HerzegovinaBrazilBulgariaBurma/MyanmarCabo VerdeCambodiaCameroonCanadaCaribbeanCentral AmericaChileChinaColombiaCongoCosta RicaCroatiaCubaCzechoslovakiaDenmarkDominicaDominican RepublicEastern AfricaEastern AsiaEastern EuropeEcuadorEgyptEl SalvadorEnglandEritreaEthiopiaEuropeFijiFranceGermanyGhanaGreeceGrenadaGuatemalaGuyanaHaitiHondurasHong KongHungaryIndiaIndonesiaIranIraqIrelandIsraelItalyJamaicaJapanJordanKazakhstanKenyaKoreaKuwaitLaosLatin AmericaLatviaLebanonLiberiaLithuaniaMalaysiaMexicoMicronesiaMiddle AfricaMoldovaMoroccoNepalNetherlandsNicaraguaNigeriaNorth AmericaNorth MacedoniaNorthern AfricaNorthern EuropeNorwayOceaniaPakistanPanamaPeruPhilippinesPolandPortugalRomaniaRussiaSaudi ArabiaScotlandSenegalSerbiaSierra LeoneSingaporeSomaliaSouth AfricaSouth AmericaSouth Central AsiaSouth Eastern AsiaSouthern EuropeSpainSri LankaSt. Vincent and the GrenadinesSudanSwedenSwitzerlandSyriaTaiwanThailandTrinidad and TobagoTurkeyUgandaUkraineUruguayUzbekistanVenezuelaVietnamWest IndiesWestern AfricaWestern AsiaWestern EuropeYemenZaireZimbabweAzores
Ugandan
Race
Ancestry
AfghanAfricanAlaska NativeAlaskan AthabascanAlbanianAleutAlsatianAmericanApacheArabArapahoArgentineanArmenianAssyrian/Chaldean/SyriacAustralianAustrianBahamianBangladeshiBarbadianBasqueBelgianBelizeanBermudanBhutaneseBlackfeetBolivianBrazilianBritishBritish West IndianBulgarianBurmeseCajunCambodianCanadianCape VerdeanCarpatho RusynCelticCentral AmericanCentral American IndianCherokeeCheyenneChickasawChileanChineseChippewaChoctawColombianColvilleComancheCosta RicanCreeCreekCroatianCrowCubanCypriotCzechCzechoslovakianDanishDelawareDominicanDutchDutch West IndianEastern EuropeanEcuadorianEgyptianEnglishEstonianEthiopianEuropeanFijianFilipinoFinnishFrenchFrench American IndianFrench CanadianGermanGerman RussianGhanaianGreekGuamanian/ChamorroGuatemalanGuyaneseHaitianHmongHonduranHopiHoumaHungarianIcelanderIndian (Asian)IndonesianInupiatIranianIraqiIrishIroquoisIsraeliItalianJamaicanJapaneseJordanianKenyanKiowaKoreanLaotianLatvianLebaneseLiberianLithuanianLumbeeLuxembourgerMacedonianMalaysianMalteseMarshalleseMenomineeMexicanMexican American IndianMongolianMoroccanNative HawaiianNavajoNepaleseNew ZealanderNicaraguanNigerianNorthern EuropeanNorwegianOkinawanOsageOttawaPaiutePakistaniPalestinianPanamanianParaguayanPennsylvania GermanPeruvianPimaPolishPortuguesePotawatomiPuebloPuerto RicanPuget Sound SalishRomanianRussianSalvadoranSamoanScandinavianScotch-IrishScottishSeminoleSenegaleseSerbianShoshoneSierra LeoneanSiouxSlavicSlovakSloveneSomaliSouth AfricanSouth AmericanSouth American IndianSoviet UnionSpaniardSpanishSpanish AmericanSpanish American IndianSri LankanSubsaharan AfricanSudaneseSwedishSwissSyrianTaiwaneseThaiTlingit-HaidaTohono O'OdhamTrinidadian and TobagonianTsimshianTurkishU.S. Virgin IslanderUgandanUkrainianUruguayanUteVenezuelanVietnameseWelshWest IndianYakamaYaquiYugoslavianYumanYup'ikZimbabwean
Immigration
NonimmigrantsImmigrantsAfghanistanAfricaAlbaniaArgentinaArmeniaAsiaAustraliaAustriaBahamasBangladeshBarbadosBelarusBelgiumBelizeBoliviaBosnia and HerzegovinaBrazilBulgariaBurma/MyanmarCabo VerdeCambodiaCameroonCanadaCaribbeanCentral AmericaChileChinaColombiaCongoCosta RicaCroatiaCubaCzechoslovakiaDenmarkDominicaDominican RepublicEastern AfricaEastern AsiaEastern EuropeEcuadorEgyptEl SalvadorEnglandEritreaEthiopiaEuropeFijiFranceGermanyGhanaGreeceGrenadaGuatemalaGuyanaHaitiHondurasHong KongHungaryIndiaIndonesiaIranIraqIrelandIsraelItalyJamaicaJapanJordanKazakhstanKenyaKoreaKuwaitLaosLatin AmericaLatviaLebanonLiberiaLithuaniaMalaysiaMexicoMicronesiaMiddle AfricaMoldovaMoroccoNepalNetherlandsNicaraguaNigeriaNorth AmericaNorth MacedoniaNorthern AfricaNorthern EuropeNorwayOceaniaPakistanPanamaPeruPhilippinesPolandPortugalRomaniaRussiaSaudi ArabiaScotlandSenegalSerbiaSierra LeoneSingaporeSomaliaSouth AfricaSouth AmericaSouth Central AsiaSouth Eastern AsiaSouthern EuropeSpainSri LankaSt. Vincent and the GrenadinesSudanSwedenSwitzerlandSyriaTaiwanThailandTrinidad and TobagoTurkeyUgandaUkraineUruguayUzbekistanVenezuelaVietnamWest IndiesWestern AfricaWestern AsiaWestern EuropeYemenZaireZimbabweAzores
Median Household Income
Income
Poverty
Unemployment
Labor Participation
Family Structure
Vehicle Availability
Education Level
Disability

Median Household Income Comparison

Tongans

Ugandans

Exceptional
Excellent
$93,076
MEDIAN HOUSEHOLD INCOME
99.4/ 100
METRIC RATING
80th/ 347
METRIC RANK
$87,557
MEDIAN HOUSEHOLD INCOME
82.9/ 100
METRIC RATING
145th/ 347
METRIC RANK

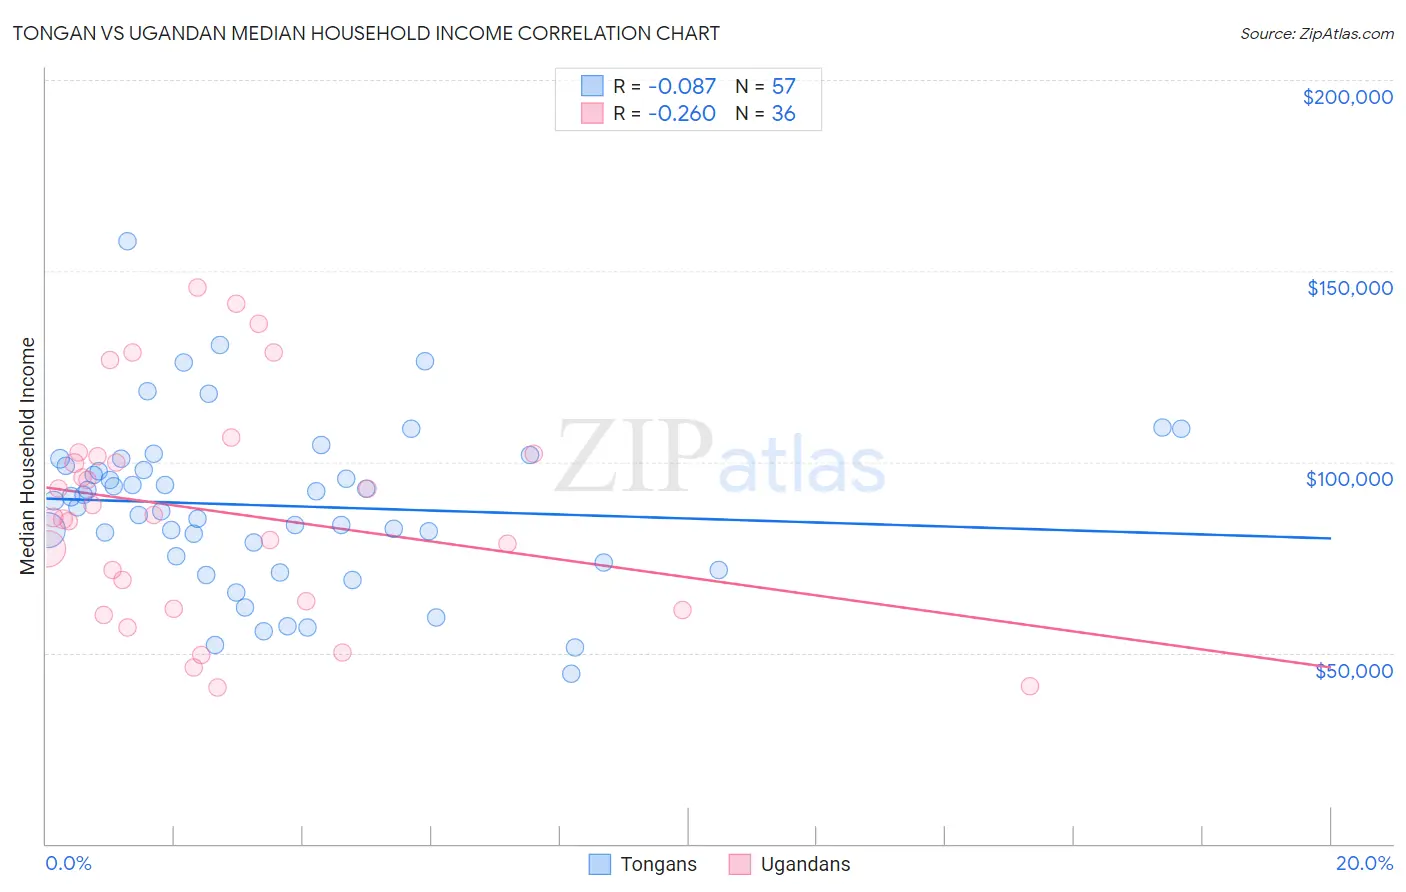
Tongan vs Ugandan Median Household Income Correlation Chart

The statistical analysis conducted on geographies consisting of 102,857,692 people shows a slight negative correlation between the proportion of Tongans and median household income in the United States with a correlation coefficient (R) of -0.087 and weighted average of $93,076. Similarly, the statistical analysis conducted on geographies consisting of 93,988,402 people shows a weak negative correlation between the proportion of Ugandans and median household income in the United States with a correlation coefficient (R) of -0.260 and weighted average of $87,557, a difference of 6.3%.
Tongan vs Ugandan Median Household Income

Median Household Income Correlation Summary

MeasurementTonganUgandan
Minimum$44,375$40,977
Maximum$157,875$145,769
Range$113,500$104,792
Mean$88,526$87,043
Median$89,840$85,898
Interquartile 25% (IQ1)$74,550$62,590
Interquartile 75% (IQ3)$99,865$101,783
Interquartile Range (IQR)$25,315$39,193
Standard Deviation (Sample)$21,499$28,515
Standard Deviation (Population)$21,310$28,116

Similar Demographics by Median Household Income

Demographics Similar to Tongans by Median Household Income

In terms of median household income, the demographic groups most similar to Tongans are Sri Lankan ($93,093, a difference of 0.020%), Immigrants from Eastern Europe ($93,051, a difference of 0.030%), Immigrants from Bulgaria ($93,148, a difference of 0.080%), Immigrants from Afghanistan ($93,375, a difference of 0.32%), and South African ($93,379, a difference of 0.33%).
DemographicsRating | RankMedian Household Income
Immigrants | Egypt
99.6
/100
|
#73
Exceptional
$93,700
Immigrants | Latvia
99.6
/100
|
#74
Exceptional
$93,602
Immigrants | Italy
99.5
/100
|
#75
Exceptional
$93,465
South Africans
99.5
/100
|
#76
Exceptional
$93,379
Immigrants | Afghanistan
99.5
/100
|
#77
Exceptional
$93,375
Immigrants | Bulgaria
99.4
/100
|
#78
Exceptional
$93,148
Sri Lankans
99.4
/100
|
#79
Exceptional
$93,093
Tongans
99.4
/100
|
#80
Exceptional
$93,076
Immigrants | Eastern Europe
99.4
/100
|
#81
Exceptional
$93,051
Immigrants | Spain
99.3
/100
|
#82
Exceptional
$92,732
Italians
99.1
/100
|
#83
Exceptional
$92,475
Immigrants | Argentina
99.1
/100
|
#84
Exceptional
$92,417
Immigrants | Croatia
99.0
/100
|
#85
Exceptional
$92,225
Immigrants | England
98.9
/100
|
#86
Exceptional
$92,098
Immigrants | Hungary
98.9
/100
|
#87
Exceptional
$92,094

Demographics Similar to Ugandans by Median Household Income

In terms of median household income, the demographic groups most similar to Ugandans are Immigrants from Uganda ($87,553, a difference of 0.0%), Serbian ($87,572, a difference of 0.020%), South American Indian ($87,446, a difference of 0.13%), Danish ($87,676, a difference of 0.14%), and Canadian ($87,769, a difference of 0.24%).
DemographicsRating | RankMedian Household Income
Arabs
89.2
/100
|
#138
Excellent
$88,398
Immigrants | Chile
89.2
/100
|
#139
Excellent
$88,388
Lebanese
87.2
/100
|
#140
Excellent
$88,091
Immigrants | Morocco
86.0
/100
|
#141
Excellent
$87,930
Canadians
84.7
/100
|
#142
Excellent
$87,769
Danes
83.9
/100
|
#143
Excellent
$87,676
Serbians
83.0
/100
|
#144
Excellent
$87,572
Ugandans
82.9
/100
|
#145
Excellent
$87,557
Immigrants | Uganda
82.8
/100
|
#146
Excellent
$87,553
South American Indians
81.8
/100
|
#147
Excellent
$87,446
Costa Ricans
80.0
/100
|
#148
Excellent
$87,262
Immigrants | Nepal
77.7
/100
|
#149
Good
$87,046
Basques
77.2
/100
|
#150
Good
$87,001
Hungarians
76.3
/100
|
#151
Good
$86,920
Immigrants | Saudi Arabia
75.8
/100
|
#152
Good
$86,875