Tohono O'odham vs Nonimmigrants Median Female Earnings
COMPARE
Tohono O'odham
Nonimmigrants
Median Female Earnings
Median Female Earnings Comparison
Tohono O'odham
Nonimmigrants
$33,205
MEDIAN FEMALE EARNINGS
0.0/ 100
METRIC RATING
340th/ 347
METRIC RANK
$37,024
MEDIAN FEMALE EARNINGS
0.4/ 100
METRIC RATING
267th/ 347
METRIC RANK
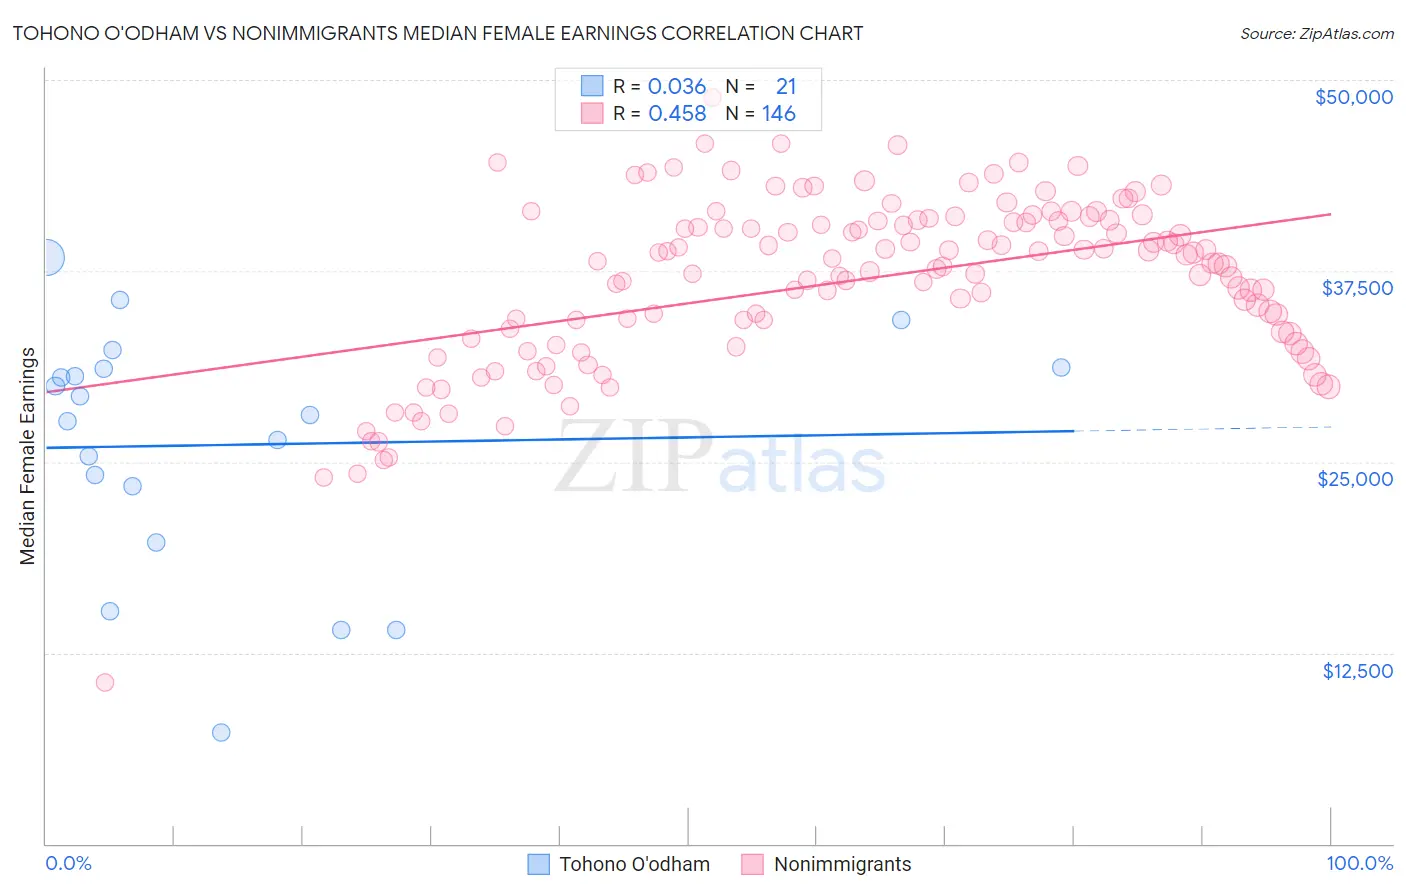
Tohono O'odham vs Nonimmigrants Median Female Earnings Correlation Chart
The statistical analysis conducted on geographies consisting of 58,716,616 people shows no correlation between the proportion of Tohono O'odham and median female earnings in the United States with a correlation coefficient (R) of 0.036 and weighted average of $33,205. Similarly, the statistical analysis conducted on geographies consisting of 581,449,824 people shows a moderate positive correlation between the proportion of Nonimmigrants and median female earnings in the United States with a correlation coefficient (R) of 0.458 and weighted average of $37,024, a difference of 11.5%.
Median Female Earnings Correlation Summary
| Measurement | Tohono O'odham | Nonimmigrants |
| Minimum | $7,287 | $10,532 |
| Maximum | $38,345 | $48,847 |
| Range | $31,058 | $38,315 |
| Mean | $26,118 | $36,884 |
| Median | $28,033 | $38,067 |
| Interquartile 25% (IQ1) | $21,596 | $33,375 |
| Interquartile 75% (IQ3) | $31,136 | $40,787 |
| Interquartile Range (IQR) | $9,540 | $7,412 |
| Standard Deviation (Sample) | $8,020 | $5,653 |
| Standard Deviation (Population) | $7,826 | $5,634 |
Similar Demographics by Median Female Earnings
Demographics Similar to Tohono O'odham by Median Female Earnings
In terms of median female earnings, the demographic groups most similar to Tohono O'odham are Immigrants from Mexico ($33,236, a difference of 0.090%), Immigrants from Cuba ($33,291, a difference of 0.26%), Yakama ($33,354, a difference of 0.45%), Navajo ($33,046, a difference of 0.48%), and Ottawa ($33,378, a difference of 0.52%).
| Demographics | Rating | Rank | Median Female Earnings |
| Mexicans | 0.0 /100 | #333 | Tragic $33,664 |
| Spanish American Indians | 0.0 /100 | #334 | Tragic $33,625 |
| Creek | 0.0 /100 | #335 | Tragic $33,437 |
| Ottawa | 0.0 /100 | #336 | Tragic $33,378 |
| Yakama | 0.0 /100 | #337 | Tragic $33,354 |
| Immigrants | Cuba | 0.0 /100 | #338 | Tragic $33,291 |
| Immigrants | Mexico | 0.0 /100 | #339 | Tragic $33,236 |
| Tohono O'odham | 0.0 /100 | #340 | Tragic $33,205 |
| Navajo | 0.0 /100 | #341 | Tragic $33,046 |
| Yup'ik | 0.0 /100 | #342 | Tragic $32,730 |
| Pueblo | 0.0 /100 | #343 | Tragic $32,564 |
| Lumbee | 0.0 /100 | #344 | Tragic $32,500 |
| Puerto Ricans | 0.0 /100 | #345 | Tragic $31,560 |
| Arapaho | 0.0 /100 | #346 | Tragic $31,489 |
| Houma | 0.0 /100 | #347 | Tragic $30,343 |
Demographics Similar to Nonimmigrants by Median Female Earnings
In terms of median female earnings, the demographic groups most similar to Nonimmigrants are Cree ($37,018, a difference of 0.010%), Dominican ($37,046, a difference of 0.060%), Immigrants from Venezuela ($37,003, a difference of 0.060%), Immigrants from Belize ($37,056, a difference of 0.090%), and Salvadoran ($37,083, a difference of 0.16%).
| Demographics | Rating | Rank | Median Female Earnings |
| Dutch | 0.7 /100 | #260 | Tragic $37,339 |
| Malaysians | 0.7 /100 | #261 | Tragic $37,298 |
| Venezuelans | 0.7 /100 | #262 | Tragic $37,282 |
| German Russians | 0.5 /100 | #263 | Tragic $37,105 |
| Salvadorans | 0.4 /100 | #264 | Tragic $37,083 |
| Immigrants | Belize | 0.4 /100 | #265 | Tragic $37,056 |
| Dominicans | 0.4 /100 | #266 | Tragic $37,046 |
| Immigrants | Nonimmigrants | 0.4 /100 | #267 | Tragic $37,024 |
| Cree | 0.4 /100 | #268 | Tragic $37,018 |
| Immigrants | Venezuela | 0.4 /100 | #269 | Tragic $37,003 |
| French American Indians | 0.3 /100 | #270 | Tragic $36,920 |
| Nicaraguans | 0.3 /100 | #271 | Tragic $36,904 |
| Immigrants | Dominican Republic | 0.3 /100 | #272 | Tragic $36,857 |
| Immigrants | Laos | 0.3 /100 | #273 | Tragic $36,841 |
| Immigrants | El Salvador | 0.2 /100 | #274 | Tragic $36,673 |