Tohono O'odham vs Native/Alaskan Median Family Income
COMPARE
Tohono O'odham
Native/Alaskan
Median Family Income
Median Family Income Comparison
Tohono O'odham
Natives/Alaskans
$72,193
MEDIAN FAMILY INCOME
0.0/ 100
METRIC RATING
344th/ 347
METRIC RANK
$80,908
MEDIAN FAMILY INCOME
0.0/ 100
METRIC RATING
332nd/ 347
METRIC RANK
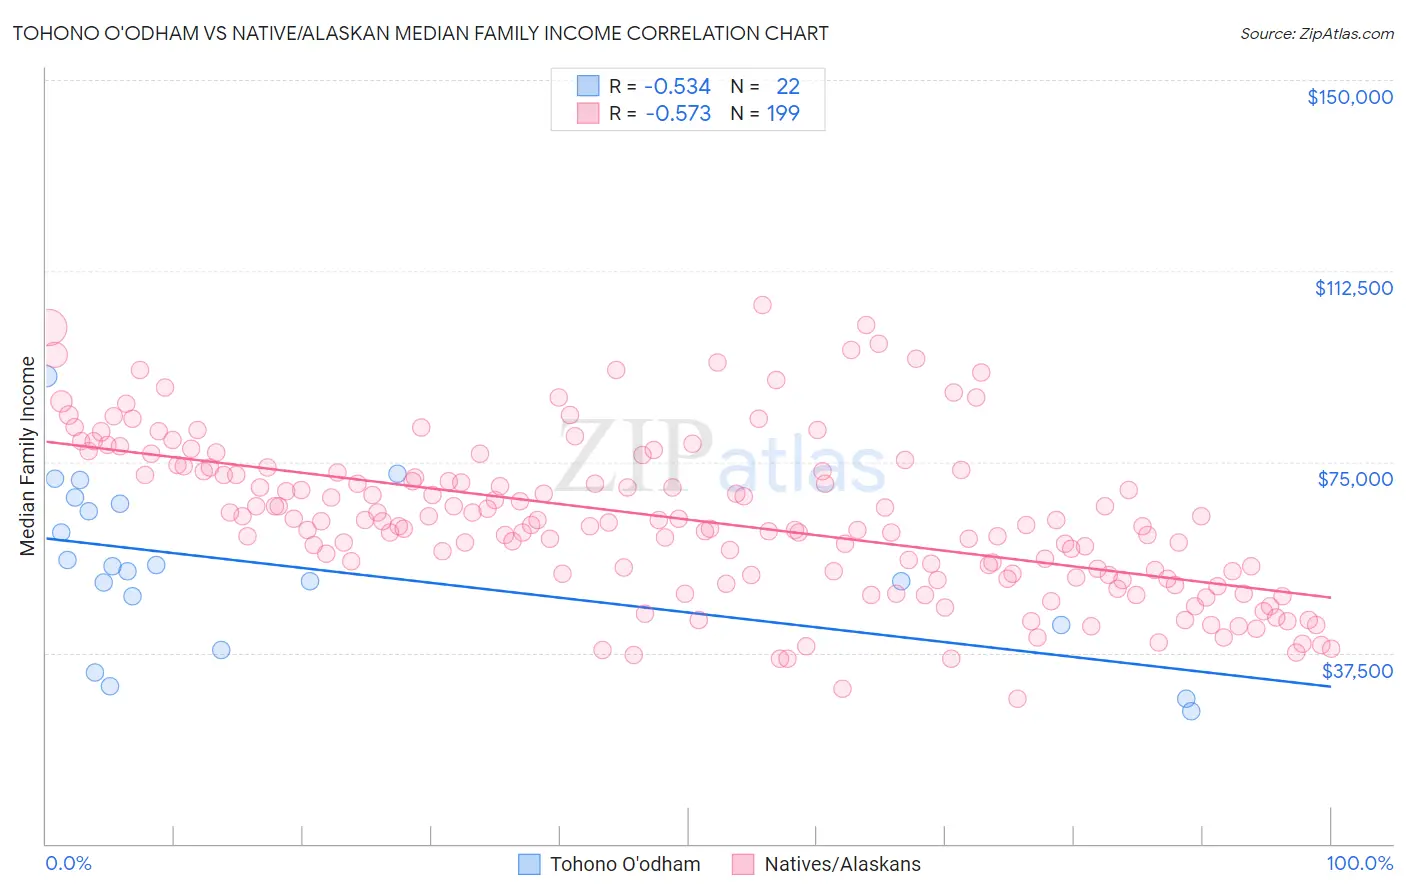
Tohono O'odham vs Native/Alaskan Median Family Income Correlation Chart
The statistical analysis conducted on geographies consisting of 58,714,192 people shows a substantial negative correlation between the proportion of Tohono O'odham and median family income in the United States with a correlation coefficient (R) of -0.534 and weighted average of $72,193. Similarly, the statistical analysis conducted on geographies consisting of 512,223,526 people shows a substantial negative correlation between the proportion of Natives/Alaskans and median family income in the United States with a correlation coefficient (R) of -0.573 and weighted average of $80,908, a difference of 12.1%.
Median Family Income Correlation Summary
| Measurement | Tohono O'odham | Native/Alaskan |
| Minimum | $26,100 | $28,542 |
| Maximum | $91,728 | $105,692 |
| Range | $65,628 | $77,150 |
| Mean | $54,111 | $63,631 |
| Median | $53,986 | $62,694 |
| Interquartile 25% (IQ1) | $43,011 | $52,723 |
| Interquartile 75% (IQ3) | $66,792 | $73,193 |
| Interquartile Range (IQR) | $23,781 | $20,470 |
| Standard Deviation (Sample) | $16,520 | $15,516 |
| Standard Deviation (Population) | $16,140 | $15,477 |
Demographics Similar to Tohono O'odham and Natives/Alaskans by Median Family Income
In terms of median family income, the demographic groups most similar to Tohono O'odham are Navajo ($70,989, a difference of 1.7%), Puerto Rican ($70,423, a difference of 2.5%), Lumbee ($68,679, a difference of 5.1%), Houma ($76,188, a difference of 5.5%), and Crow ($76,605, a difference of 6.1%). Similarly, the demographic groups most similar to Natives/Alaskans are Kiowa ($80,885, a difference of 0.030%), Immigrants from Dominican Republic ($81,233, a difference of 0.40%), Cheyenne ($81,385, a difference of 0.59%), Dutch West Indian ($81,852, a difference of 1.2%), and Black/African American ($81,912, a difference of 1.2%).
| Demographics | Rating | Rank | Median Family Income |
| Blacks/African Americans | 0.0 /100 | #328 | Tragic $81,912 |
| Dutch West Indians | 0.0 /100 | #329 | Tragic $81,852 |
| Cheyenne | 0.0 /100 | #330 | Tragic $81,385 |
| Immigrants | Dominican Republic | 0.0 /100 | #331 | Tragic $81,233 |
| Natives/Alaskans | 0.0 /100 | #332 | Tragic $80,908 |
| Kiowa | 0.0 /100 | #333 | Tragic $80,885 |
| Menominee | 0.0 /100 | #334 | Tragic $79,563 |
| Yup'ik | 0.0 /100 | #335 | Tragic $79,290 |
| Immigrants | Cuba | 0.0 /100 | #336 | Tragic $78,249 |
| Yuman | 0.0 /100 | #337 | Tragic $78,055 |
| Immigrants | Yemen | 0.0 /100 | #338 | Tragic $77,457 |
| Pima | 0.0 /100 | #339 | Tragic $77,431 |
| Hopi | 0.0 /100 | #340 | Tragic $77,188 |
| Pueblo | 0.0 /100 | #341 | Tragic $76,880 |
| Crow | 0.0 /100 | #342 | Tragic $76,605 |
| Houma | 0.0 /100 | #343 | Tragic $76,188 |
| Tohono O'odham | 0.0 /100 | #344 | Tragic $72,193 |
| Navajo | 0.0 /100 | #345 | Tragic $70,989 |
| Puerto Ricans | 0.0 /100 | #346 | Tragic $70,423 |
| Lumbee | 0.0 /100 | #347 | Tragic $68,679 |