Tlingit-Haida vs Immigrants from Ukraine Householder Income Ages 45 - 64 years

COMPARE

Tlingit-Haida
Race
Ancestry
AfghanAfricanAlaska NativeAlaskan AthabascanAlbanianAleutAlsatianAmericanApacheArabArapahoArgentineanArmenianAssyrian/Chaldean/SyriacAustralianAustrianBahamianBangladeshiBarbadianBasqueBelgianBelizeanBermudanBhutaneseBlackfeetBolivianBrazilianBritishBritish West IndianBulgarianBurmeseCajunCambodianCanadianCape VerdeanCarpatho RusynCelticCentral AmericanCentral American IndianCherokeeCheyenneChickasawChileanChineseChippewaChoctawColombianColvilleComancheCosta RicanCreeCreekCroatianCrowCubanCypriotCzechCzechoslovakianDanishDelawareDominicanDutchDutch West IndianEastern EuropeanEcuadorianEgyptianEnglishEstonianEthiopianEuropeanFijianFilipinoFinnishFrenchFrench American IndianFrench CanadianGermanGerman RussianGhanaianGreekGuamanian/ChamorroGuatemalanGuyaneseHaitianHmongHonduranHopiHoumaHungarianIcelanderIndian (Asian)IndonesianInupiatIranianIraqiIrishIroquoisIsraeliItalianJamaicanJapaneseJordanianKenyanKiowaKoreanLaotianLatvianLebaneseLiberianLithuanianLumbeeLuxembourgerMacedonianMalaysianMalteseMarshalleseMenomineeMexicanMexican American IndianMongolianMoroccanNative HawaiianNavajoNepaleseNew ZealanderNicaraguanNigerianNorthern EuropeanNorwegianOkinawanOsageOttawaPaiutePakistaniPalestinianPanamanianParaguayanPennsylvania GermanPeruvianPimaPolishPortuguesePotawatomiPuebloPuerto RicanPuget Sound SalishRomanianRussianSalvadoranSamoanScandinavianScotch-IrishScottishSeminoleSenegaleseSerbianShoshoneSierra LeoneanSiouxSlavicSlovakSloveneSomaliSouth AfricanSouth AmericanSouth American IndianSoviet UnionSpaniardSpanishSpanish AmericanSpanish American IndianSri LankanSubsaharan AfricanSudaneseSwedishSwissSyrianTaiwaneseThaiTlingit-HaidaTohono O'OdhamTonganTrinidadian and TobagonianTsimshianTurkishU.S. Virgin IslanderUgandanUkrainianUruguayanUteVenezuelanVietnameseWelshWest IndianYakamaYaquiYugoslavianYumanYup'ikZimbabwean
Immigration
NonimmigrantsImmigrantsAfghanistanAfricaAlbaniaArgentinaArmeniaAsiaAustraliaAustriaBahamasBangladeshBarbadosBelarusBelgiumBelizeBoliviaBosnia and HerzegovinaBrazilBulgariaBurma/MyanmarCabo VerdeCambodiaCameroonCanadaCaribbeanCentral AmericaChileChinaColombiaCongoCosta RicaCroatiaCubaCzechoslovakiaDenmarkDominicaDominican RepublicEastern AfricaEastern AsiaEastern EuropeEcuadorEgyptEl SalvadorEnglandEritreaEthiopiaEuropeFijiFranceGermanyGhanaGreeceGrenadaGuatemalaGuyanaHaitiHondurasHong KongHungaryIndiaIndonesiaIranIraqIrelandIsraelItalyJamaicaJapanJordanKazakhstanKenyaKoreaKuwaitLaosLatin AmericaLatviaLebanonLiberiaLithuaniaMalaysiaMexicoMicronesiaMiddle AfricaMoldovaMoroccoNepalNetherlandsNicaraguaNigeriaNorth AmericaNorth MacedoniaNorthern AfricaNorthern EuropeNorwayOceaniaPakistanPanamaPeruPhilippinesPolandPortugalRomaniaRussiaSaudi ArabiaScotlandSenegalSerbiaSierra LeoneSingaporeSomaliaSouth AfricaSouth AmericaSouth Central AsiaSouth Eastern AsiaSouthern EuropeSpainSri LankaSt. Vincent and the GrenadinesSudanSwedenSwitzerlandSyriaTaiwanThailandTrinidad and TobagoTurkeyUgandaUruguayUzbekistanVenezuelaVietnamWest IndiesWestern AfricaWestern AsiaWestern EuropeYemenZaireZimbabweAzores
Immigrants from Ukraine
Race
Ancestry
AfghanAfricanAlaska NativeAlaskan AthabascanAlbanianAleutAlsatianAmericanApacheArabArapahoArgentineanArmenianAssyrian/Chaldean/SyriacAustralianAustrianBahamianBangladeshiBarbadianBasqueBelgianBelizeanBermudanBhutaneseBlackfeetBolivianBrazilianBritishBritish West IndianBulgarianBurmeseCajunCambodianCanadianCape VerdeanCarpatho RusynCelticCentral AmericanCentral American IndianCherokeeCheyenneChickasawChileanChineseChippewaChoctawColombianColvilleComancheCosta RicanCreeCreekCroatianCrowCubanCypriotCzechCzechoslovakianDanishDelawareDominicanDutchDutch West IndianEastern EuropeanEcuadorianEgyptianEnglishEstonianEthiopianEuropeanFijianFilipinoFinnishFrenchFrench American IndianFrench CanadianGermanGerman RussianGhanaianGreekGuamanian/ChamorroGuatemalanGuyaneseHaitianHmongHonduranHopiHoumaHungarianIcelanderIndian (Asian)IndonesianInupiatIranianIraqiIrishIroquoisIsraeliItalianJamaicanJapaneseJordanianKenyanKiowaKoreanLaotianLatvianLebaneseLiberianLithuanianLumbeeLuxembourgerMacedonianMalaysianMalteseMarshalleseMenomineeMexicanMexican American IndianMongolianMoroccanNative HawaiianNavajoNepaleseNew ZealanderNicaraguanNigerianNorthern EuropeanNorwegianOkinawanOsageOttawaPaiutePakistaniPalestinianPanamanianParaguayanPennsylvania GermanPeruvianPimaPolishPortuguesePotawatomiPuebloPuerto RicanPuget Sound SalishRomanianRussianSalvadoranSamoanScandinavianScotch-IrishScottishSeminoleSenegaleseSerbianShoshoneSierra LeoneanSiouxSlavicSlovakSloveneSomaliSouth AfricanSouth AmericanSouth American IndianSoviet UnionSpaniardSpanishSpanish AmericanSpanish American IndianSri LankanSubsaharan AfricanSudaneseSwedishSwissSyrianTaiwaneseThaiTohono O'OdhamTonganTrinidadian and TobagonianTsimshianTurkishU.S. Virgin IslanderUgandanUkrainianUruguayanUteVenezuelanVietnameseWelshWest IndianYakamaYaquiYugoslavianYumanYup'ikZimbabwean
Immigration
NonimmigrantsImmigrantsAfghanistanAfricaAlbaniaArgentinaArmeniaAsiaAustraliaAustriaBahamasBangladeshBarbadosBelarusBelgiumBelizeBoliviaBosnia and HerzegovinaBrazilBulgariaBurma/MyanmarCabo VerdeCambodiaCameroonCanadaCaribbeanCentral AmericaChileChinaColombiaCongoCosta RicaCroatiaCubaCzechoslovakiaDenmarkDominicaDominican RepublicEastern AfricaEastern AsiaEastern EuropeEcuadorEgyptEl SalvadorEnglandEritreaEthiopiaEuropeFijiFranceGermanyGhanaGreeceGrenadaGuatemalaGuyanaHaitiHondurasHong KongHungaryIndiaIndonesiaIranIraqIrelandIsraelItalyJamaicaJapanJordanKazakhstanKenyaKoreaKuwaitLaosLatin AmericaLatviaLebanonLiberiaLithuaniaMalaysiaMexicoMicronesiaMiddle AfricaMoldovaMoroccoNepalNetherlandsNicaraguaNigeriaNorth AmericaNorth MacedoniaNorthern AfricaNorthern EuropeNorwayOceaniaPakistanPanamaPeruPhilippinesPolandPortugalRomaniaRussiaSaudi ArabiaScotlandSenegalSerbiaSierra LeoneSingaporeSomaliaSouth AfricaSouth AmericaSouth Central AsiaSouth Eastern AsiaSouthern EuropeSpainSri LankaSt. Vincent and the GrenadinesSudanSwedenSwitzerlandSyriaTaiwanThailandTrinidad and TobagoTurkeyUgandaUkraineUruguayUzbekistanVenezuelaVietnamWest IndiesWestern AfricaWestern AsiaWestern EuropeYemenZaireZimbabweAzores
Householder Income Ages 45 - 64 years
Income
Poverty
Unemployment
Labor Participation
Family Structure
Vehicle Availability
Education Level
Disability

Householder Income Ages 45 - 64 years Comparison

Tlingit-Haida

Immigrants from Ukraine

Poor
Exceptional
$97,417
HOUSEHOLDER INCOME AGES 45 - 64 YEARS
18.9/ 100
METRIC RATING
202nd/ 347
METRIC RANK
$107,079
HOUSEHOLDER INCOME AGES 45 - 64 YEARS
96.7/ 100
METRIC RATING
104th/ 347
METRIC RANK

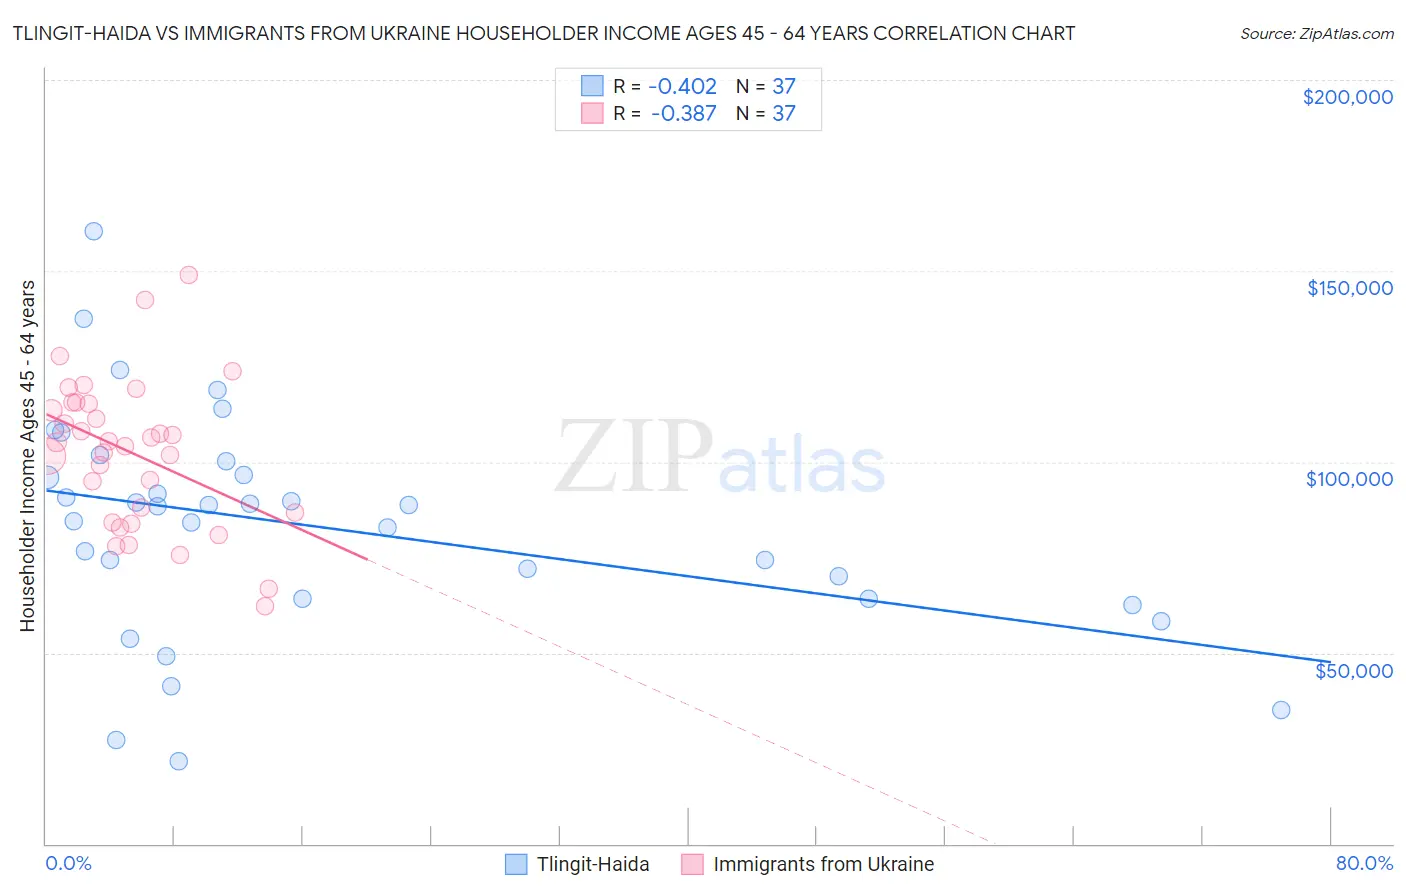
Tlingit-Haida vs Immigrants from Ukraine Householder Income Ages 45 - 64 years Correlation Chart

The statistical analysis conducted on geographies consisting of 60,826,750 people shows a moderate negative correlation between the proportion of Tlingit-Haida and household income with householder between the ages 45 and 64 in the United States with a correlation coefficient (R) of -0.402 and weighted average of $97,417. Similarly, the statistical analysis conducted on geographies consisting of 289,443,409 people shows a mild negative correlation between the proportion of Immigrants from Ukraine and household income with householder between the ages 45 and 64 in the United States with a correlation coefficient (R) of -0.387 and weighted average of $107,079, a difference of 9.9%.
Tlingit-Haida vs Immigrants from Ukraine Householder Income Ages 45 - 64 years

Householder Income Ages 45 - 64 years Correlation Summary

MeasurementTlingit-HaidaImmigrants from Ukraine
Minimum$21,563$62,178
Maximum$160,485$148,942
Range$138,922$86,764
Mean$83,137$102,397
Median$88,264$105,174
Interquartile 25% (IQ1)$64,077$85,429
Interquartile 75% (IQ3)$98,405$115,436
Interquartile Range (IQR)$34,328$30,007
Standard Deviation (Sample)$29,197$19,369
Standard Deviation (Population)$28,800$19,105

Similar Demographics by Householder Income Ages 45 - 64 years

Demographics Similar to Tlingit-Haida by Householder Income Ages 45 - 64 years

In terms of householder income ages 45 - 64 years, the demographic groups most similar to Tlingit-Haida are Immigrants from Thailand ($97,400, a difference of 0.020%), Immigrants from Eritrea ($97,373, a difference of 0.040%), Immigrants from Colombia ($97,290, a difference of 0.13%), Immigrants from Africa ($97,284, a difference of 0.14%), and Ghanaian ($97,277, a difference of 0.14%).
DemographicsRating | RankHouseholder Income Ages 45 - 64 years
Spanish
29.2
/100
|
#195
Fair
$98,554
Immigrants | Eastern Africa
28.3
/100
|
#196
Fair
$98,467
Puget Sound Salish
27.0
/100
|
#197
Fair
$98,340
Immigrants | Iraq
25.7
/100
|
#198
Fair
$98,201
Whites/Caucasians
24.6
/100
|
#199
Fair
$98,091
Immigrants | Kenya
23.5
/100
|
#200
Fair
$97,964
Yugoslavians
20.0
/100
|
#201
Fair
$97,558
Tlingit-Haida
18.9
/100
|
#202
Poor
$97,417
Immigrants | Thailand
18.8
/100
|
#203
Poor
$97,400
Immigrants | Eritrea
18.6
/100
|
#204
Poor
$97,373
Immigrants | Colombia
18.0
/100
|
#205
Poor
$97,290
Immigrants | Africa
17.9
/100
|
#206
Poor
$97,284
Ghanaians
17.9
/100
|
#207
Poor
$97,277
Scotch-Irish
16.4
/100
|
#208
Poor
$97,073
Japanese
14.8
/100
|
#209
Poor
$96,834

Demographics Similar to Immigrants from Ukraine by Householder Income Ages 45 - 64 years

In terms of householder income ages 45 - 64 years, the demographic groups most similar to Immigrants from Ukraine are Macedonian ($107,074, a difference of 0.0%), Armenian ($107,002, a difference of 0.070%), Syrian ($107,207, a difference of 0.12%), Immigrants from Fiji ($106,952, a difference of 0.12%), and Zimbabwean ($106,849, a difference of 0.22%).
DemographicsRating | RankHouseholder Income Ages 45 - 64 years
Northern Europeans
97.8
/100
|
#97
Exceptional
$107,870
Immigrants | Southern Europe
97.7
/100
|
#98
Exceptional
$107,775
Palestinians
97.6
/100
|
#99
Exceptional
$107,721
Immigrants | Serbia
97.4
/100
|
#100
Exceptional
$107,569
Immigrants | Kazakhstan
97.2
/100
|
#101
Exceptional
$107,378
Immigrants | Moldova
97.1
/100
|
#102
Exceptional
$107,357
Syrians
96.9
/100
|
#103
Exceptional
$107,207
Immigrants | Ukraine
96.7
/100
|
#104
Exceptional
$107,079
Macedonians
96.7
/100
|
#105
Exceptional
$107,074
Armenians
96.6
/100
|
#106
Exceptional
$107,002
Immigrants | Fiji
96.5
/100
|
#107
Exceptional
$106,952
Zimbabweans
96.3
/100
|
#108
Exceptional
$106,849
Chileans
95.9
/100
|
#109
Exceptional
$106,611
Immigrants | Brazil
95.6
/100
|
#110
Exceptional
$106,470
Immigrants | Vietnam
95.5
/100
|
#111
Exceptional
$106,417