Thai vs Cheyenne Householder Income Ages 25 - 44 years
COMPARE
Thai
Cheyenne
Householder Income Ages 25 - 44 years
Householder Income Ages 25 - 44 years Comparison
Thais
Cheyenne
$121,778
HOUSEHOLDER INCOME AGES 25 - 44 YEARS
100.0/ 100
METRIC RATING
6th/ 347
METRIC RANK
$79,152
HOUSEHOLDER INCOME AGES 25 - 44 YEARS
0.0/ 100
METRIC RATING
314th/ 347
METRIC RANK
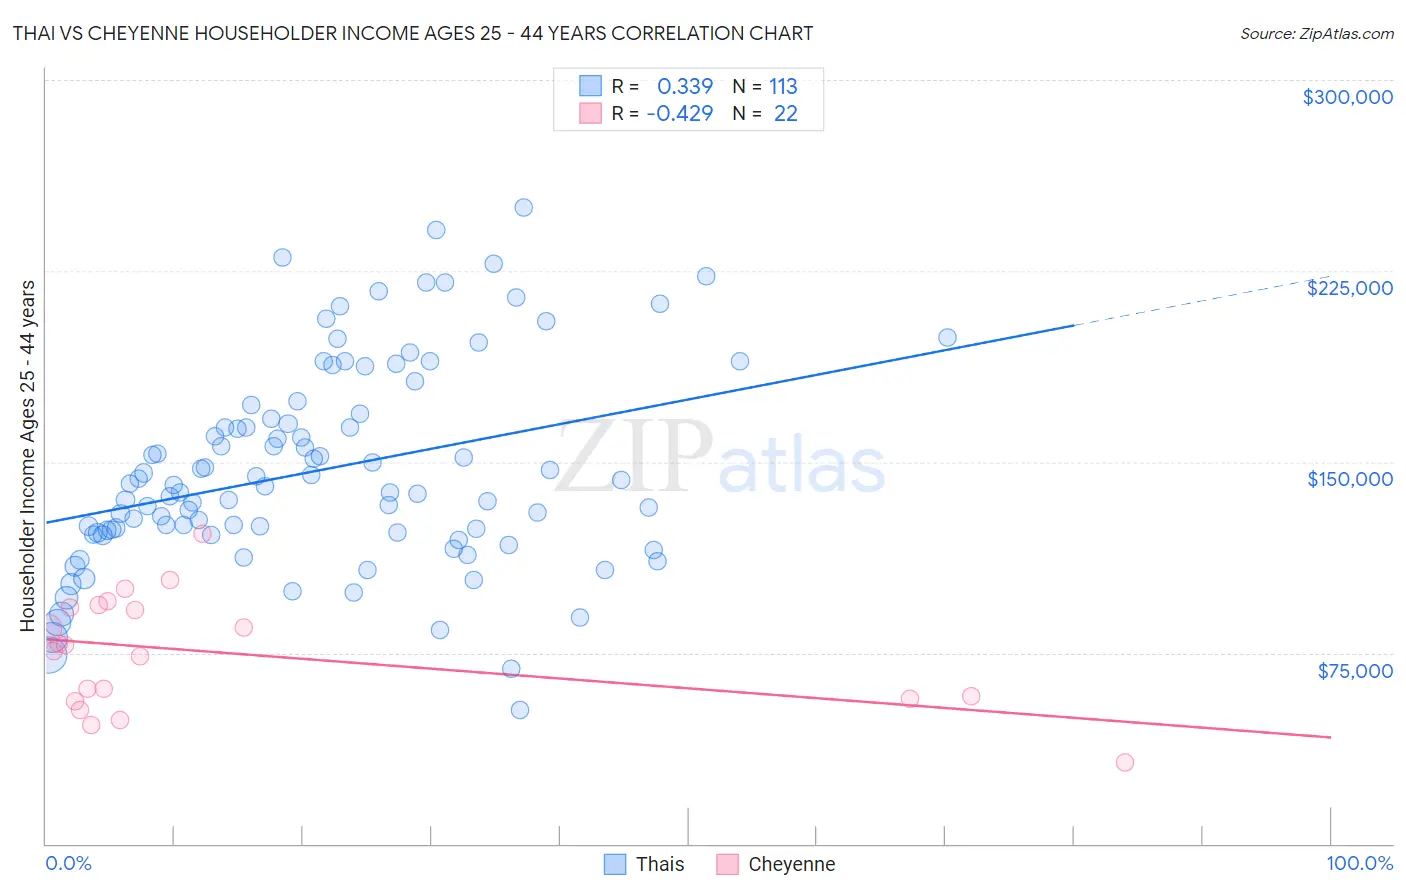
Thai vs Cheyenne Householder Income Ages 25 - 44 years Correlation Chart
The statistical analysis conducted on geographies consisting of 474,108,438 people shows a mild positive correlation between the proportion of Thais and household income with householder between the ages 25 and 44 in the United States with a correlation coefficient (R) of 0.339 and weighted average of $121,778. Similarly, the statistical analysis conducted on geographies consisting of 80,627,434 people shows a moderate negative correlation between the proportion of Cheyenne and household income with householder between the ages 25 and 44 in the United States with a correlation coefficient (R) of -0.429 and weighted average of $79,152, a difference of 53.8%.
Householder Income Ages 25 - 44 years Correlation Summary
| Measurement | Thai | Cheyenne |
| Minimum | $52,604 | $32,083 |
| Maximum | $250,001 | $121,699 |
| Range | $197,397 | $89,616 |
| Mean | $146,679 | $74,807 |
| Median | $140,455 | $76,769 |
| Interquartile 25% (IQ1) | $121,721 | $56,719 |
| Interquartile 75% (IQ3) | $167,903 | $92,585 |
| Interquartile Range (IQR) | $46,181 | $35,866 |
| Standard Deviation (Sample) | $39,916 | $22,346 |
| Standard Deviation (Population) | $39,739 | $21,832 |
Similar Demographics by Householder Income Ages 25 - 44 years
Demographics Similar to Thais by Householder Income Ages 25 - 44 years
In terms of householder income ages 25 - 44 years, the demographic groups most similar to Thais are Immigrants from Ireland ($120,333, a difference of 1.2%), Iranian ($120,292, a difference of 1.2%), Immigrants from China ($119,756, a difference of 1.7%), Indian (Asian) ($119,496, a difference of 1.9%), and Immigrants from India ($124,238, a difference of 2.0%).
| Demographics | Rating | Rank | Householder Income Ages 25 - 44 years |
| Immigrants | Taiwan | 100.0 /100 | #1 | Exceptional $129,122 |
| Filipinos | 100.0 /100 | #2 | Exceptional $128,723 |
| Immigrants | Hong Kong | 100.0 /100 | #3 | Exceptional $128,140 |
| Immigrants | Singapore | 100.0 /100 | #4 | Exceptional $124,429 |
| Immigrants | India | 100.0 /100 | #5 | Exceptional $124,238 |
| Thais | 100.0 /100 | #6 | Exceptional $121,778 |
| Immigrants | Ireland | 100.0 /100 | #7 | Exceptional $120,333 |
| Iranians | 100.0 /100 | #8 | Exceptional $120,292 |
| Immigrants | China | 100.0 /100 | #9 | Exceptional $119,756 |
| Indians (Asian) | 100.0 /100 | #10 | Exceptional $119,496 |
| Okinawans | 100.0 /100 | #11 | Exceptional $119,349 |
| Immigrants | Iran | 100.0 /100 | #12 | Exceptional $119,204 |
| Immigrants | Eastern Asia | 100.0 /100 | #13 | Exceptional $118,056 |
| Immigrants | Israel | 100.0 /100 | #14 | Exceptional $117,219 |
| Immigrants | South Central Asia | 100.0 /100 | #15 | Exceptional $116,626 |
Demographics Similar to Cheyenne by Householder Income Ages 25 - 44 years
In terms of householder income ages 25 - 44 years, the demographic groups most similar to Cheyenne are Ottawa ($79,012, a difference of 0.18%), African ($78,986, a difference of 0.21%), Menominee ($79,358, a difference of 0.26%), Immigrants from Haiti ($79,391, a difference of 0.30%), and U.S. Virgin Islander ($78,911, a difference of 0.30%).
| Demographics | Rating | Rank | Householder Income Ages 25 - 44 years |
| Haitians | 0.0 /100 | #307 | Tragic $80,055 |
| Immigrants | Central America | 0.0 /100 | #308 | Tragic $80,012 |
| Chippewa | 0.0 /100 | #309 | Tragic $80,005 |
| Fijians | 0.0 /100 | #310 | Tragic $79,956 |
| Indonesians | 0.0 /100 | #311 | Tragic $79,543 |
| Immigrants | Haiti | 0.0 /100 | #312 | Tragic $79,391 |
| Menominee | 0.0 /100 | #313 | Tragic $79,358 |
| Cheyenne | 0.0 /100 | #314 | Tragic $79,152 |
| Ottawa | 0.0 /100 | #315 | Tragic $79,012 |
| Africans | 0.0 /100 | #316 | Tragic $78,986 |
| U.S. Virgin Islanders | 0.0 /100 | #317 | Tragic $78,911 |
| Immigrants | Mexico | 0.0 /100 | #318 | Tragic $78,809 |
| Hondurans | 0.0 /100 | #319 | Tragic $78,540 |
| Choctaw | 0.0 /100 | #320 | Tragic $78,168 |
| Immigrants | Zaire | 0.0 /100 | #321 | Tragic $78,045 |