Taiwanese vs Ugandan Median Female Earnings
COMPARE
Taiwanese
Ugandan
Median Female Earnings
Median Female Earnings Comparison
Taiwanese
Ugandans
$40,576
MEDIAN FEMALE EARNINGS
86.1/ 100
METRIC RATING
138th/ 347
METRIC RANK
$40,889
MEDIAN FEMALE EARNINGS
92.2/ 100
METRIC RATING
127th/ 347
METRIC RANK
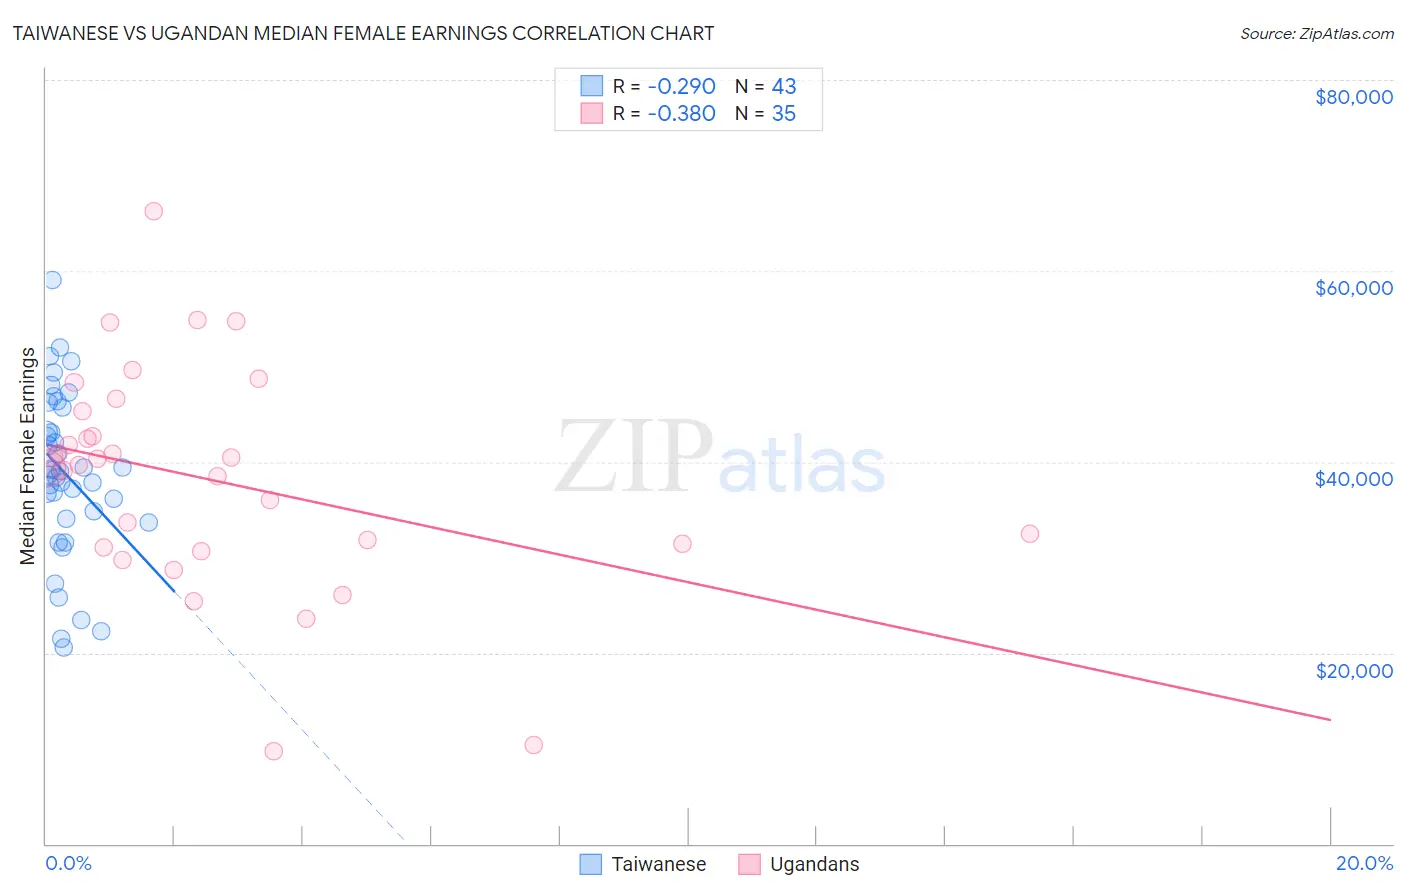
Taiwanese vs Ugandan Median Female Earnings Correlation Chart
The statistical analysis conducted on geographies consisting of 31,721,885 people shows a weak negative correlation between the proportion of Taiwanese and median female earnings in the United States with a correlation coefficient (R) of -0.290 and weighted average of $40,576. Similarly, the statistical analysis conducted on geographies consisting of 94,007,517 people shows a mild negative correlation between the proportion of Ugandans and median female earnings in the United States with a correlation coefficient (R) of -0.380 and weighted average of $40,889, a difference of 0.77%.
Median Female Earnings Correlation Summary
| Measurement | Taiwanese | Ugandan |
| Minimum | $20,555 | $9,732 |
| Maximum | $59,093 | $66,250 |
| Range | $38,538 | $56,518 |
| Mean | $38,751 | $38,170 |
| Median | $39,019 | $39,623 |
| Interquartile 25% (IQ1) | $34,095 | $31,024 |
| Interquartile 75% (IQ3) | $45,655 | $45,270 |
| Interquartile Range (IQR) | $11,560 | $14,246 |
| Standard Deviation (Sample) | $8,643 | $11,739 |
| Standard Deviation (Population) | $8,542 | $11,570 |
Demographics Similar to Taiwanese and Ugandans by Median Female Earnings
In terms of median female earnings, the demographic groups most similar to Taiwanese are Immigrants from South Eastern Asia ($40,558, a difference of 0.040%), Pakistani ($40,596, a difference of 0.050%), Serbian ($40,539, a difference of 0.090%), Immigrants from Eastern Africa ($40,644, a difference of 0.17%), and Immigrants from Syria ($40,499, a difference of 0.19%). Similarly, the demographic groups most similar to Ugandans are Immigrants from Trinidad and Tobago ($40,895, a difference of 0.020%), Austrian ($40,923, a difference of 0.080%), Carpatho Rusyn ($40,825, a difference of 0.16%), Trinidadian and Tobagonian ($40,958, a difference of 0.17%), and Guyanese ($40,973, a difference of 0.21%).
| Demographics | Rating | Rank | Median Female Earnings |
| Immigrants | Jordan | 93.5 /100 | #122 | Exceptional $40,977 |
| Guyanese | 93.4 /100 | #123 | Exceptional $40,973 |
| Trinidadians and Tobagonians | 93.2 /100 | #124 | Exceptional $40,958 |
| Austrians | 92.7 /100 | #125 | Exceptional $40,923 |
| Immigrants | Trinidad and Tobago | 92.3 /100 | #126 | Exceptional $40,895 |
| Ugandans | 92.2 /100 | #127 | Exceptional $40,889 |
| Carpatho Rusyns | 91.2 /100 | #128 | Exceptional $40,825 |
| Zimbabweans | 90.8 /100 | #129 | Exceptional $40,798 |
| Immigrants | Guyana | 90.3 /100 | #130 | Exceptional $40,773 |
| Chileans | 90.0 /100 | #131 | Exceptional $40,757 |
| Immigrants | Uganda | 89.7 /100 | #132 | Excellent $40,739 |
| Syrians | 89.5 /100 | #133 | Excellent $40,727 |
| Arabs | 89.3 /100 | #134 | Excellent $40,718 |
| Immigrants | Nepal | 89.0 /100 | #135 | Excellent $40,704 |
| Immigrants | Eastern Africa | 87.7 /100 | #136 | Excellent $40,644 |
| Pakistanis | 86.6 /100 | #137 | Excellent $40,596 |
| Taiwanese | 86.1 /100 | #138 | Excellent $40,576 |
| Immigrants | South Eastern Asia | 85.7 /100 | #139 | Excellent $40,558 |
| Serbians | 85.2 /100 | #140 | Excellent $40,539 |
| Immigrants | Syria | 84.1 /100 | #141 | Excellent $40,499 |
| Sri Lankans | 84.0 /100 | #142 | Excellent $40,496 |