Taiwanese vs Laotian Median Family Income
COMPARE
Taiwanese
Laotian
Median Family Income
Median Family Income Comparison
Taiwanese
Laotians
$107,295
MEDIAN FAMILY INCOME
91.4/ 100
METRIC RATING
125th/ 347
METRIC RANK
$112,859
MEDIAN FAMILY INCOME
99.5/ 100
METRIC RATING
73rd/ 347
METRIC RANK
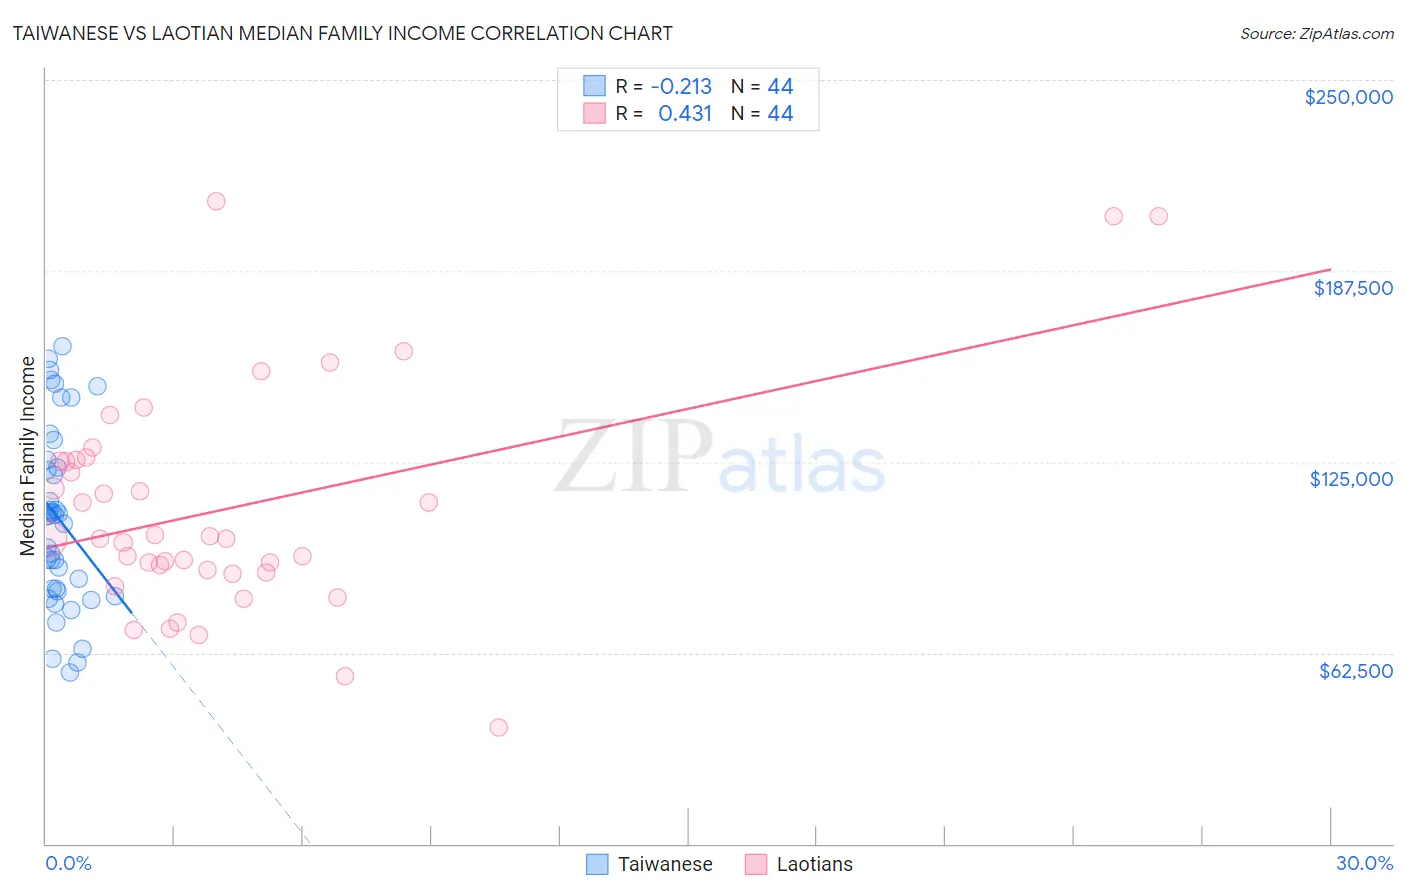
Taiwanese vs Laotian Median Family Income Correlation Chart
The statistical analysis conducted on geographies consisting of 31,709,765 people shows a weak negative correlation between the proportion of Taiwanese and median family income in the United States with a correlation coefficient (R) of -0.213 and weighted average of $107,295. Similarly, the statistical analysis conducted on geographies consisting of 224,714,380 people shows a moderate positive correlation between the proportion of Laotians and median family income in the United States with a correlation coefficient (R) of 0.431 and weighted average of $112,859, a difference of 5.2%.
Median Family Income Correlation Summary
| Measurement | Taiwanese | Laotian |
| Minimum | $56,146 | $38,056 |
| Maximum | $162,974 | $210,375 |
| Range | $106,828 | $172,319 |
| Mean | $106,094 | $109,887 |
| Median | $107,372 | $99,824 |
| Interquartile 25% (IQ1) | $83,038 | $89,104 |
| Interquartile 75% (IQ3) | $124,300 | $125,414 |
| Interquartile Range (IQR) | $41,262 | $36,309 |
| Standard Deviation (Sample) | $29,129 | $37,256 |
| Standard Deviation (Population) | $28,796 | $36,830 |
Similar Demographics by Median Family Income
Demographics Similar to Taiwanese by Median Family Income
In terms of median family income, the demographic groups most similar to Taiwanese are Pakistani ($107,390, a difference of 0.090%), Serbian ($107,157, a difference of 0.13%), Carpatho Rusyn ($107,502, a difference of 0.19%), Lebanese ($107,086, a difference of 0.19%), and Immigrants from Ethiopia ($106,969, a difference of 0.30%).
| Demographics | Rating | Rank | Median Family Income |
| Ethiopians | 94.5 /100 | #118 | Exceptional $108,251 |
| Sri Lankans | 94.5 /100 | #119 | Exceptional $108,234 |
| Immigrants | Northern Africa | 94.3 /100 | #120 | Exceptional $108,161 |
| Europeans | 94.1 /100 | #121 | Exceptional $108,099 |
| Immigrants | Jordan | 92.9 /100 | #122 | Exceptional $107,715 |
| Carpatho Rusyns | 92.2 /100 | #123 | Exceptional $107,502 |
| Pakistanis | 91.7 /100 | #124 | Exceptional $107,390 |
| Taiwanese | 91.4 /100 | #125 | Exceptional $107,295 |
| Serbians | 90.8 /100 | #126 | Exceptional $107,157 |
| Lebanese | 90.5 /100 | #127 | Exceptional $107,086 |
| Immigrants | Ethiopia | 90.0 /100 | #128 | Excellent $106,969 |
| Arabs | 89.9 /100 | #129 | Excellent $106,952 |
| Brazilians | 89.8 /100 | #130 | Excellent $106,942 |
| Canadians | 88.1 /100 | #131 | Excellent $106,597 |
| Immigrants | Fiji | 87.8 /100 | #132 | Excellent $106,544 |
Demographics Similar to Laotians by Median Family Income
In terms of median family income, the demographic groups most similar to Laotians are Immigrants from Italy ($112,848, a difference of 0.010%), Afghan ($112,971, a difference of 0.10%), Immigrants from Western Europe ($112,688, a difference of 0.15%), Argentinean ($112,665, a difference of 0.17%), and Immigrants from Eastern Europe ($112,527, a difference of 0.30%).
| Demographics | Rating | Rank | Median Family Income |
| Paraguayans | 99.7 /100 | #66 | Exceptional $114,016 |
| Immigrants | Spain | 99.7 /100 | #67 | Exceptional $113,815 |
| Immigrants | Serbia | 99.6 /100 | #68 | Exceptional $113,463 |
| Immigrants | Bulgaria | 99.6 /100 | #69 | Exceptional $113,461 |
| Immigrants | Romania | 99.6 /100 | #70 | Exceptional $113,434 |
| South Africans | 99.5 /100 | #71 | Exceptional $113,229 |
| Afghans | 99.5 /100 | #72 | Exceptional $112,971 |
| Laotians | 99.5 /100 | #73 | Exceptional $112,859 |
| Immigrants | Italy | 99.4 /100 | #74 | Exceptional $112,848 |
| Immigrants | Western Europe | 99.4 /100 | #75 | Exceptional $112,688 |
| Argentineans | 99.4 /100 | #76 | Exceptional $112,665 |
| Immigrants | Eastern Europe | 99.4 /100 | #77 | Exceptional $112,527 |
| Immigrants | Canada | 99.3 /100 | #78 | Exceptional $112,374 |
| Italians | 99.3 /100 | #79 | Exceptional $112,372 |
| Immigrants | Croatia | 99.3 /100 | #80 | Exceptional $112,323 |