Taiwanese vs Immigrants from Senegal Householder Income Ages 45 - 64 years

COMPARE

Taiwanese
Race
Ancestry
AfghanAfricanAlaska NativeAlaskan AthabascanAlbanianAleutAlsatianAmericanApacheArabArapahoArgentineanArmenianAssyrian/Chaldean/SyriacAustralianAustrianBahamianBangladeshiBarbadianBasqueBelgianBelizeanBermudanBhutaneseBlackfeetBolivianBrazilianBritishBritish West IndianBulgarianBurmeseCajunCambodianCanadianCape VerdeanCarpatho RusynCelticCentral AmericanCentral American IndianCherokeeCheyenneChickasawChileanChineseChippewaChoctawColombianColvilleComancheCosta RicanCreeCreekCroatianCrowCubanCypriotCzechCzechoslovakianDanishDelawareDominicanDutchDutch West IndianEastern EuropeanEcuadorianEgyptianEnglishEstonianEthiopianEuropeanFijianFilipinoFinnishFrenchFrench American IndianFrench CanadianGermanGerman RussianGhanaianGreekGuamanian/ChamorroGuatemalanGuyaneseHaitianHmongHonduranHopiHoumaHungarianIcelanderIndian (Asian)IndonesianInupiatIranianIraqiIrishIroquoisIsraeliItalianJamaicanJapaneseJordanianKenyanKiowaKoreanLaotianLatvianLebaneseLiberianLithuanianLumbeeLuxembourgerMacedonianMalaysianMalteseMarshalleseMenomineeMexicanMexican American IndianMongolianMoroccanNative HawaiianNavajoNepaleseNew ZealanderNicaraguanNigerianNorthern EuropeanNorwegianOkinawanOsageOttawaPaiutePakistaniPalestinianPanamanianParaguayanPennsylvania GermanPeruvianPimaPolishPortuguesePotawatomiPuebloPuerto RicanPuget Sound SalishRomanianRussianSalvadoranSamoanScandinavianScotch-IrishScottishSeminoleSenegaleseSerbianShoshoneSierra LeoneanSiouxSlavicSlovakSloveneSomaliSouth AfricanSouth AmericanSouth American IndianSoviet UnionSpaniardSpanishSpanish AmericanSpanish American IndianSri LankanSubsaharan AfricanSudaneseSwedishSwissSyrianTaiwaneseThaiTlingit-HaidaTohono O'OdhamTonganTrinidadian and TobagonianTsimshianTurkishU.S. Virgin IslanderUgandanUkrainianUruguayanUteVenezuelanVietnameseWelshWest IndianYakamaYaquiYugoslavianYumanYup'ikZimbabwean
Immigration
NonimmigrantsImmigrantsAfghanistanAfricaAlbaniaArgentinaArmeniaAsiaAustraliaAustriaBahamasBangladeshBarbadosBelarusBelgiumBelizeBoliviaBosnia and HerzegovinaBrazilBulgariaBurma/MyanmarCabo VerdeCambodiaCameroonCanadaCaribbeanCentral AmericaChileChinaColombiaCongoCosta RicaCroatiaCubaCzechoslovakiaDenmarkDominicaDominican RepublicEastern AfricaEastern AsiaEastern EuropeEcuadorEgyptEl SalvadorEnglandEritreaEthiopiaEuropeFijiFranceGermanyGhanaGreeceGrenadaGuatemalaGuyanaHaitiHondurasHong KongHungaryIndiaIndonesiaIranIraqIrelandIsraelItalyJamaicaJapanJordanKazakhstanKenyaKoreaKuwaitLaosLatin AmericaLatviaLebanonLiberiaLithuaniaMalaysiaMexicoMicronesiaMiddle AfricaMoldovaMoroccoNepalNetherlandsNicaraguaNigeriaNorth AmericaNorth MacedoniaNorthern AfricaNorthern EuropeNorwayOceaniaPakistanPanamaPeruPhilippinesPolandPortugalRomaniaRussiaSaudi ArabiaScotlandSerbiaSierra LeoneSingaporeSomaliaSouth AfricaSouth AmericaSouth Central AsiaSouth Eastern AsiaSouthern EuropeSpainSri LankaSt. Vincent and the GrenadinesSudanSwedenSwitzerlandSyriaTaiwanThailandTrinidad and TobagoTurkeyUgandaUkraineUruguayUzbekistanVenezuelaVietnamWest IndiesWestern AfricaWestern AsiaWestern EuropeYemenZaireZimbabweAzores
Immigrants from Senegal
Race
Ancestry
AfghanAfricanAlaska NativeAlaskan AthabascanAlbanianAleutAlsatianAmericanApacheArabArapahoArgentineanArmenianAssyrian/Chaldean/SyriacAustralianAustrianBahamianBangladeshiBarbadianBasqueBelgianBelizeanBermudanBhutaneseBlackfeetBolivianBrazilianBritishBritish West IndianBulgarianBurmeseCajunCambodianCanadianCape VerdeanCarpatho RusynCelticCentral AmericanCentral American IndianCherokeeCheyenneChickasawChileanChineseChippewaChoctawColombianColvilleComancheCosta RicanCreeCreekCroatianCrowCubanCypriotCzechCzechoslovakianDanishDelawareDominicanDutchDutch West IndianEastern EuropeanEcuadorianEgyptianEnglishEstonianEthiopianEuropeanFijianFilipinoFinnishFrenchFrench American IndianFrench CanadianGermanGerman RussianGhanaianGreekGuamanian/ChamorroGuatemalanGuyaneseHaitianHmongHonduranHopiHoumaHungarianIcelanderIndian (Asian)IndonesianInupiatIranianIraqiIrishIroquoisIsraeliItalianJamaicanJapaneseJordanianKenyanKiowaKoreanLaotianLatvianLebaneseLiberianLithuanianLumbeeLuxembourgerMacedonianMalaysianMalteseMarshalleseMenomineeMexicanMexican American IndianMongolianMoroccanNative HawaiianNavajoNepaleseNew ZealanderNicaraguanNigerianNorthern EuropeanNorwegianOkinawanOsageOttawaPaiutePakistaniPalestinianPanamanianParaguayanPennsylvania GermanPeruvianPimaPolishPortuguesePotawatomiPuebloPuerto RicanPuget Sound SalishRomanianRussianSalvadoranSamoanScandinavianScotch-IrishScottishSeminoleSenegaleseSerbianShoshoneSierra LeoneanSiouxSlavicSlovakSloveneSomaliSouth AfricanSouth AmericanSouth American IndianSoviet UnionSpaniardSpanishSpanish AmericanSpanish American IndianSri LankanSubsaharan AfricanSudaneseSwedishSwissSyrianThaiTlingit-HaidaTohono O'OdhamTonganTrinidadian and TobagonianTsimshianTurkishU.S. Virgin IslanderUgandanUkrainianUruguayanUteVenezuelanVietnameseWelshWest IndianYakamaYaquiYugoslavianYumanYup'ikZimbabwean
Immigration
NonimmigrantsImmigrantsAfghanistanAfricaAlbaniaArgentinaArmeniaAsiaAustraliaAustriaBahamasBangladeshBarbadosBelarusBelgiumBelizeBoliviaBosnia and HerzegovinaBrazilBulgariaBurma/MyanmarCabo VerdeCambodiaCameroonCanadaCaribbeanCentral AmericaChileChinaColombiaCongoCosta RicaCroatiaCubaCzechoslovakiaDenmarkDominicaDominican RepublicEastern AfricaEastern AsiaEastern EuropeEcuadorEgyptEl SalvadorEnglandEritreaEthiopiaEuropeFijiFranceGermanyGhanaGreeceGrenadaGuatemalaGuyanaHaitiHondurasHong KongHungaryIndiaIndonesiaIranIraqIrelandIsraelItalyJamaicaJapanJordanKazakhstanKenyaKoreaKuwaitLaosLatin AmericaLatviaLebanonLiberiaLithuaniaMalaysiaMexicoMicronesiaMiddle AfricaMoldovaMoroccoNepalNetherlandsNicaraguaNigeriaNorth AmericaNorth MacedoniaNorthern AfricaNorthern EuropeNorwayOceaniaPakistanPanamaPeruPhilippinesPolandPortugalRomaniaRussiaSaudi ArabiaScotlandSenegalSerbiaSierra LeoneSingaporeSomaliaSouth AfricaSouth AmericaSouth Central AsiaSouth Eastern AsiaSouthern EuropeSpainSri LankaSt. Vincent and the GrenadinesSudanSwedenSwitzerlandSyriaTaiwanThailandTrinidad and TobagoTurkeyUgandaUkraineUruguayUzbekistanVenezuelaVietnamWest IndiesWestern AfricaWestern AsiaWestern EuropeYemenZaireZimbabweAzores
Householder Income Ages 45 - 64 years
Income
Poverty
Unemployment
Labor Participation
Family Structure
Vehicle Availability
Education Level
Disability

Householder Income Ages 45 - 64 years Comparison

Taiwanese

Immigrants from Senegal

Excellent
Tragic
$104,180
HOUSEHOLDER INCOME AGES 45 - 64 YEARS
87.4/ 100
METRIC RATING
136th/ 347
METRIC RANK
$88,421
HOUSEHOLDER INCOME AGES 45 - 64 YEARS
0.3/ 100
METRIC RATING
263rd/ 347
METRIC RANK

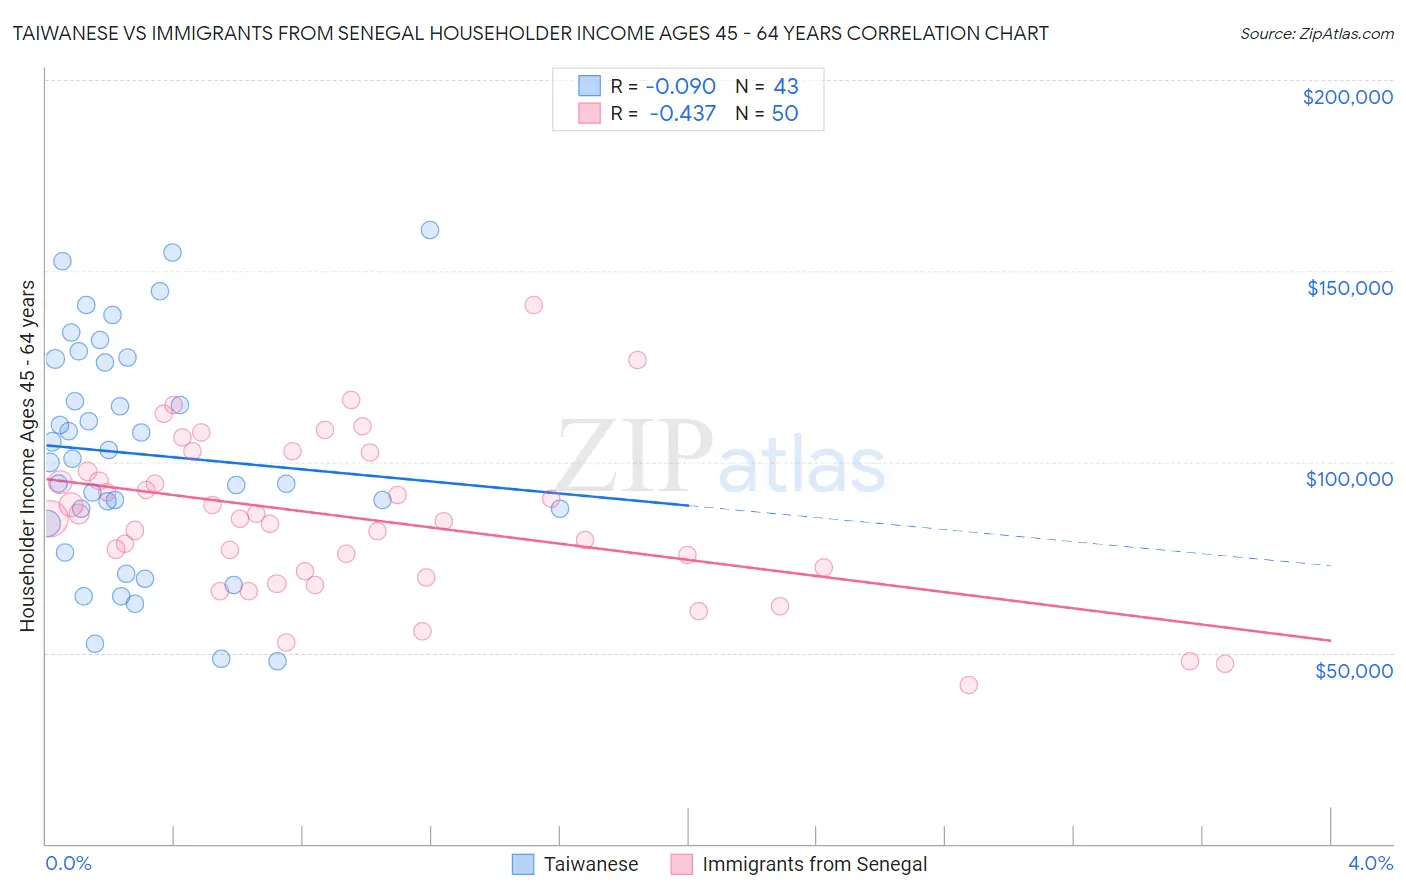
Taiwanese vs Immigrants from Senegal Householder Income Ages 45 - 64 years Correlation Chart

The statistical analysis conducted on geographies consisting of 31,709,295 people shows a slight negative correlation between the proportion of Taiwanese and household income with householder between the ages 45 and 64 in the United States with a correlation coefficient (R) of -0.090 and weighted average of $104,180. Similarly, the statistical analysis conducted on geographies consisting of 90,099,692 people shows a moderate negative correlation between the proportion of Immigrants from Senegal and household income with householder between the ages 45 and 64 in the United States with a correlation coefficient (R) of -0.437 and weighted average of $88,421, a difference of 17.8%.
Taiwanese vs Immigrants from Senegal Householder Income Ages 45 - 64 years

Householder Income Ages 45 - 64 years Correlation Summary

MeasurementTaiwaneseImmigrants from Senegal
Minimum$47,813$41,574
Maximum$160,833$140,938
Range$113,020$99,364
Mean$102,027$85,290
Median$100,891$85,076
Interquartile 25% (IQ1)$83,846$71,475
Interquartile 75% (IQ3)$126,896$97,575
Interquartile Range (IQR)$43,050$26,100
Standard Deviation (Sample)$29,530$20,782
Standard Deviation (Population)$29,184$20,574

Similar Demographics by Householder Income Ages 45 - 64 years

Demographics Similar to Taiwanese by Householder Income Ages 45 - 64 years

In terms of householder income ages 45 - 64 years, the demographic groups most similar to Taiwanese are Brazilian ($104,408, a difference of 0.22%), Hungarian ($103,913, a difference of 0.26%), Canadian ($104,560, a difference of 0.36%), Arab ($104,566, a difference of 0.37%), and Ethiopian ($103,736, a difference of 0.43%).
DemographicsRating | RankHouseholder Income Ages 45 - 64 years
Peruvians
91.5
/100
|
#129
Exceptional
$105,070
Immigrants | Zimbabwe
91.2
/100
|
#130
Exceptional
$104,992
Immigrants | Syria
90.7
/100
|
#131
Exceptional
$104,858
Lebanese
90.1
/100
|
#132
Exceptional
$104,734
Arabs
89.3
/100
|
#133
Excellent
$104,566
Canadians
89.3
/100
|
#134
Excellent
$104,560
Brazilians
88.6
/100
|
#135
Excellent
$104,408
Taiwanese
87.4
/100
|
#136
Excellent
$104,180
Hungarians
85.8
/100
|
#137
Excellent
$103,913
Ethiopians
84.7
/100
|
#138
Excellent
$103,736
Immigrants | Oceania
84.5
/100
|
#139
Excellent
$103,705
Norwegians
84.3
/100
|
#140
Excellent
$103,682
Immigrants | Uganda
83.7
/100
|
#141
Excellent
$103,584
Luxembourgers
83.3
/100
|
#142
Excellent
$103,536
Serbians
83.2
/100
|
#143
Excellent
$103,522

Demographics Similar to Immigrants from Senegal by Householder Income Ages 45 - 64 years

In terms of householder income ages 45 - 64 years, the demographic groups most similar to Immigrants from Senegal are Osage ($88,390, a difference of 0.040%), Jamaican ($88,327, a difference of 0.11%), Somali ($88,600, a difference of 0.20%), Immigrants from West Indies ($88,164, a difference of 0.29%), and Belizean ($88,684, a difference of 0.30%).
DemographicsRating | RankHouseholder Income Ages 45 - 64 years
French American Indians
0.5
/100
|
#256
Tragic
$89,811
German Russians
0.4
/100
|
#257
Tragic
$89,398
Immigrants | Barbados
0.4
/100
|
#258
Tragic
$89,394
Immigrants | Nicaragua
0.4
/100
|
#259
Tragic
$89,108
Liberians
0.3
/100
|
#260
Tragic
$88,929
Belizeans
0.3
/100
|
#261
Tragic
$88,684
Somalis
0.3
/100
|
#262
Tragic
$88,600
Immigrants | Senegal
0.3
/100
|
#263
Tragic
$88,421
Osage
0.3
/100
|
#264
Tragic
$88,390
Jamaicans
0.2
/100
|
#265
Tragic
$88,327
Immigrants | West Indies
0.2
/100
|
#266
Tragic
$88,164
Hmong
0.2
/100
|
#267
Tragic
$88,115
Immigrants | Micronesia
0.2
/100
|
#268
Tragic
$87,864
Spanish Americans
0.2
/100
|
#269
Tragic
$87,836
Immigrants | Liberia
0.2
/100
|
#270
Tragic
$87,739