Taiwanese vs Immigrants from Fiji Median Household Income
COMPARE
Taiwanese
Immigrants from Fiji
Median Household Income
Median Household Income Comparison
Taiwanese
Immigrants from Fiji
$89,900
MEDIAN HOUSEHOLD INCOME
95.6/ 100
METRIC RATING
117th/ 347
METRIC RANK
$93,933
MEDIAN HOUSEHOLD INCOME
99.7/ 100
METRIC RATING
70th/ 347
METRIC RANK
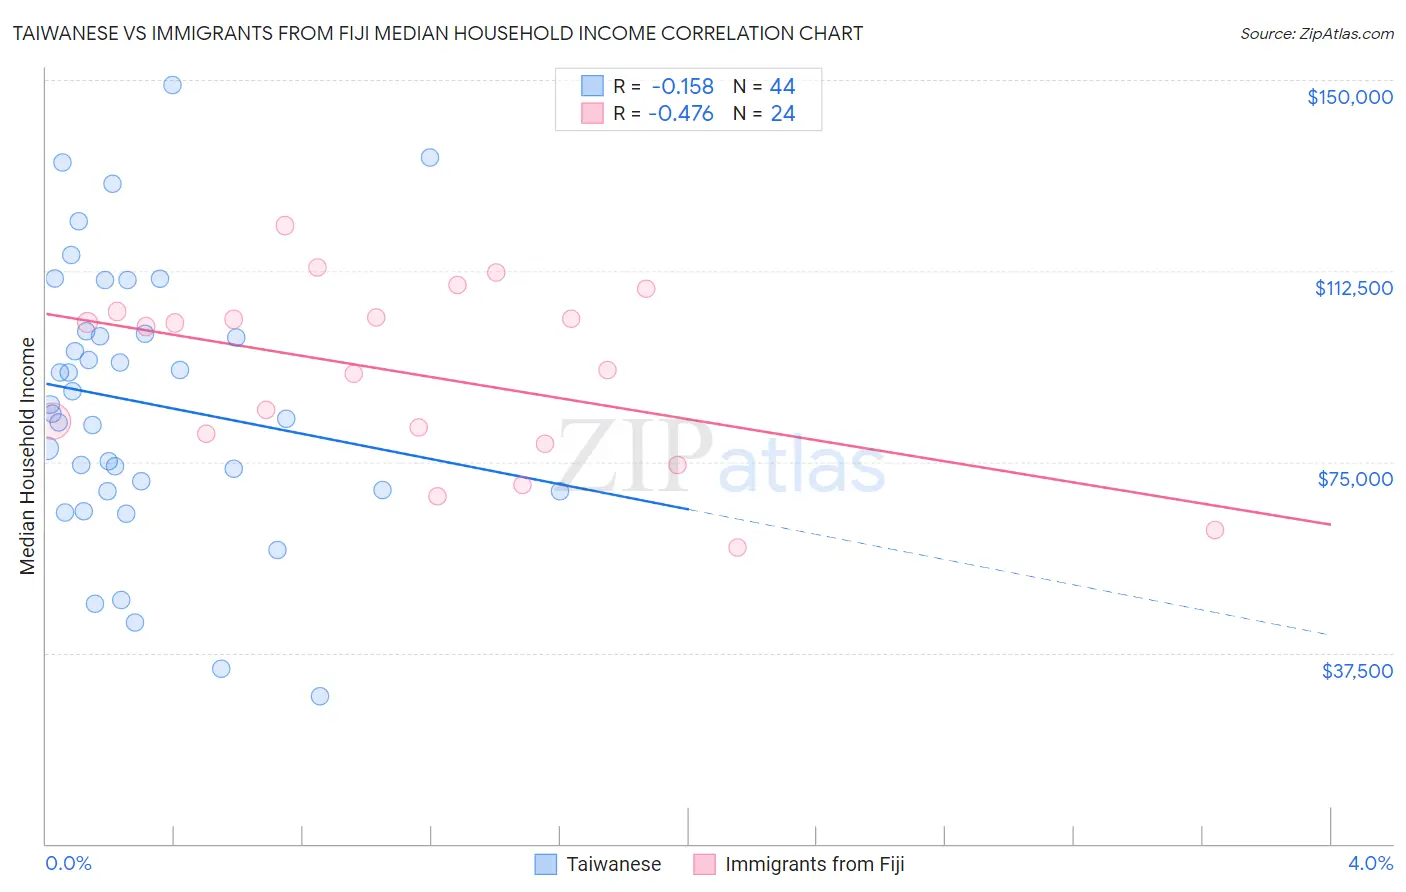
Taiwanese vs Immigrants from Fiji Median Household Income Correlation Chart
The statistical analysis conducted on geographies consisting of 31,709,765 people shows a poor negative correlation between the proportion of Taiwanese and median household income in the United States with a correlation coefficient (R) of -0.158 and weighted average of $89,900. Similarly, the statistical analysis conducted on geographies consisting of 93,754,169 people shows a moderate negative correlation between the proportion of Immigrants from Fiji and median household income in the United States with a correlation coefficient (R) of -0.476 and weighted average of $93,933, a difference of 4.5%.
Median Household Income Correlation Summary
| Measurement | Taiwanese | Immigrants from Fiji |
| Minimum | $29,038 | $58,122 |
| Maximum | $149,028 | $121,408 |
| Range | $119,990 | $63,286 |
| Mean | $86,573 | $92,206 |
| Median | $85,327 | $97,285 |
| Interquartile 25% (IQ1) | $69,445 | $79,580 |
| Interquartile 75% (IQ3) | $100,383 | $103,956 |
| Interquartile Range (IQR) | $30,938 | $24,377 |
| Standard Deviation (Sample) | $26,800 | $17,579 |
| Standard Deviation (Population) | $26,494 | $17,209 |
Similar Demographics by Median Household Income
Demographics Similar to Taiwanese by Median Household Income
In terms of median household income, the demographic groups most similar to Taiwanese are Native Hawaiian ($89,919, a difference of 0.020%), Syrian ($89,830, a difference of 0.080%), Immigrants from Western Asia ($90,005, a difference of 0.12%), Immigrants from Northern Africa ($90,026, a difference of 0.14%), and Albanian ($89,744, a difference of 0.17%).
| Demographics | Rating | Rank | Median Household Income |
| Palestinians | 97.1 /100 | #110 | Exceptional $90,574 |
| Immigrants | Poland | 97.1 /100 | #111 | Exceptional $90,549 |
| Northern Europeans | 96.9 /100 | #112 | Exceptional $90,446 |
| Peruvians | 96.5 /100 | #113 | Exceptional $90,261 |
| Immigrants | Northern Africa | 95.9 /100 | #114 | Exceptional $90,026 |
| Immigrants | Western Asia | 95.9 /100 | #115 | Exceptional $90,005 |
| Native Hawaiians | 95.7 /100 | #116 | Exceptional $89,919 |
| Taiwanese | 95.6 /100 | #117 | Exceptional $89,900 |
| Syrians | 95.4 /100 | #118 | Exceptional $89,830 |
| Albanians | 95.2 /100 | #119 | Exceptional $89,744 |
| Immigrants | North Macedonia | 95.2 /100 | #120 | Exceptional $89,741 |
| Ethiopians | 94.9 /100 | #121 | Exceptional $89,640 |
| Pakistanis | 94.8 /100 | #122 | Exceptional $89,638 |
| Immigrants | Zimbabwe | 94.4 /100 | #123 | Exceptional $89,496 |
| Immigrants | Jordan | 94.1 /100 | #124 | Exceptional $89,412 |
Demographics Similar to Immigrants from Fiji by Median Household Income
In terms of median household income, the demographic groups most similar to Immigrants from Fiji are Argentinean ($93,960, a difference of 0.030%), Mongolian ($93,971, a difference of 0.040%), Immigrants from Philippines ($93,899, a difference of 0.040%), Lithuanian ($93,852, a difference of 0.090%), and Immigrants from Scotland ($94,091, a difference of 0.17%).
| Demographics | Rating | Rank | Median Household Income |
| Greeks | 99.8 /100 | #63 | Exceptional $94,735 |
| Immigrants | Netherlands | 99.7 /100 | #64 | Exceptional $94,411 |
| Immigrants | Belarus | 99.7 /100 | #65 | Exceptional $94,399 |
| Immigrants | Romania | 99.7 /100 | #66 | Exceptional $94,222 |
| Immigrants | Scotland | 99.7 /100 | #67 | Exceptional $94,091 |
| Mongolians | 99.7 /100 | #68 | Exceptional $93,971 |
| Argentineans | 99.7 /100 | #69 | Exceptional $93,960 |
| Immigrants | Fiji | 99.7 /100 | #70 | Exceptional $93,933 |
| Immigrants | Philippines | 99.6 /100 | #71 | Exceptional $93,899 |
| Lithuanians | 99.6 /100 | #72 | Exceptional $93,852 |
| Immigrants | Egypt | 99.6 /100 | #73 | Exceptional $93,700 |
| Immigrants | Latvia | 99.6 /100 | #74 | Exceptional $93,602 |
| Immigrants | Italy | 99.5 /100 | #75 | Exceptional $93,465 |
| South Africans | 99.5 /100 | #76 | Exceptional $93,379 |
| Immigrants | Afghanistan | 99.5 /100 | #77 | Exceptional $93,375 |