Syrian vs Samoan Householder Income Ages 25 - 44 years

COMPARE

Syrian
Race
Ancestry
AfghanAfricanAlaska NativeAlaskan AthabascanAlbanianAleutAlsatianAmericanApacheArabArapahoArgentineanArmenianAssyrian/Chaldean/SyriacAustralianAustrianBahamianBangladeshiBarbadianBasqueBelgianBelizeanBermudanBhutaneseBlackfeetBolivianBrazilianBritishBritish West IndianBulgarianBurmeseCajunCambodianCanadianCape VerdeanCarpatho RusynCelticCentral AmericanCentral American IndianCherokeeCheyenneChickasawChileanChineseChippewaChoctawColombianColvilleComancheCosta RicanCreeCreekCroatianCrowCubanCypriotCzechCzechoslovakianDanishDelawareDominicanDutchDutch West IndianEastern EuropeanEcuadorianEgyptianEnglishEstonianEthiopianEuropeanFijianFilipinoFinnishFrenchFrench American IndianFrench CanadianGermanGerman RussianGhanaianGreekGuamanian/ChamorroGuatemalanGuyaneseHaitianHmongHonduranHopiHoumaHungarianIcelanderIndian (Asian)IndonesianInupiatIranianIraqiIrishIroquoisIsraeliItalianJamaicanJapaneseJordanianKenyanKiowaKoreanLaotianLatvianLebaneseLiberianLithuanianLumbeeLuxembourgerMacedonianMalaysianMalteseMarshalleseMenomineeMexicanMexican American IndianMongolianMoroccanNative HawaiianNavajoNepaleseNew ZealanderNicaraguanNigerianNorthern EuropeanNorwegianOkinawanOsageOttawaPaiutePakistaniPalestinianPanamanianParaguayanPennsylvania GermanPeruvianPimaPolishPortuguesePotawatomiPuebloPuerto RicanPuget Sound SalishRomanianRussianSalvadoranScandinavianScotch-IrishScottishSeminoleSenegaleseSerbianShoshoneSierra LeoneanSiouxSlavicSlovakSloveneSomaliSouth AfricanSouth AmericanSouth American IndianSoviet UnionSpaniardSpanishSpanish AmericanSpanish American IndianSri LankanSubsaharan AfricanSudaneseSwedishSwissSyrianTaiwaneseThaiTlingit-HaidaTohono O'OdhamTonganTrinidadian and TobagonianTsimshianTurkishU.S. Virgin IslanderUgandanUkrainianUruguayanUteVenezuelanVietnameseWelshWest IndianYakamaYaquiYugoslavianYumanYup'ikZimbabwean
Immigration
NonimmigrantsImmigrantsAfghanistanAfricaAlbaniaArgentinaArmeniaAsiaAustraliaAustriaBahamasBangladeshBarbadosBelarusBelgiumBelizeBoliviaBosnia and HerzegovinaBrazilBulgariaBurma/MyanmarCabo VerdeCambodiaCameroonCanadaCaribbeanCentral AmericaChileChinaColombiaCongoCosta RicaCroatiaCubaCzechoslovakiaDenmarkDominicaDominican RepublicEastern AfricaEastern AsiaEastern EuropeEcuadorEgyptEl SalvadorEnglandEritreaEthiopiaEuropeFijiFranceGermanyGhanaGreeceGrenadaGuatemalaGuyanaHaitiHondurasHong KongHungaryIndiaIndonesiaIranIraqIrelandIsraelItalyJamaicaJapanJordanKazakhstanKenyaKoreaKuwaitLaosLatin AmericaLatviaLebanonLiberiaLithuaniaMalaysiaMexicoMicronesiaMiddle AfricaMoldovaMoroccoNepalNetherlandsNicaraguaNigeriaNorth AmericaNorth MacedoniaNorthern AfricaNorthern EuropeNorwayOceaniaPakistanPanamaPeruPhilippinesPolandPortugalRomaniaRussiaSaudi ArabiaScotlandSenegalSerbiaSierra LeoneSingaporeSomaliaSouth AfricaSouth AmericaSouth Central AsiaSouth Eastern AsiaSouthern EuropeSpainSri LankaSt. Vincent and the GrenadinesSudanSwedenSwitzerlandSyriaTaiwanThailandTrinidad and TobagoTurkeyUgandaUkraineUruguayUzbekistanVenezuelaVietnamWest IndiesWestern AfricaWestern AsiaWestern EuropeYemenZaireZimbabweAzores
Samoan
Race
Ancestry
AfghanAfricanAlaska NativeAlaskan AthabascanAlbanianAleutAlsatianAmericanApacheArabArapahoArgentineanArmenianAssyrian/Chaldean/SyriacAustralianAustrianBahamianBangladeshiBarbadianBasqueBelgianBelizeanBermudanBhutaneseBlackfeetBolivianBrazilianBritishBritish West IndianBulgarianBurmeseCajunCambodianCanadianCape VerdeanCarpatho RusynCelticCentral AmericanCentral American IndianCherokeeCheyenneChickasawChileanChineseChippewaChoctawColombianColvilleComancheCosta RicanCreeCreekCroatianCrowCubanCypriotCzechCzechoslovakianDanishDelawareDominicanDutchDutch West IndianEastern EuropeanEcuadorianEgyptianEnglishEstonianEthiopianEuropeanFijianFilipinoFinnishFrenchFrench American IndianFrench CanadianGermanGerman RussianGhanaianGreekGuamanian/ChamorroGuatemalanGuyaneseHaitianHmongHonduranHopiHoumaHungarianIcelanderIndian (Asian)IndonesianInupiatIranianIraqiIrishIroquoisIsraeliItalianJamaicanJapaneseJordanianKenyanKiowaKoreanLaotianLatvianLebaneseLiberianLithuanianLumbeeLuxembourgerMacedonianMalaysianMalteseMarshalleseMenomineeMexicanMexican American IndianMongolianMoroccanNative HawaiianNavajoNepaleseNew ZealanderNicaraguanNigerianNorthern EuropeanNorwegianOkinawanOsageOttawaPaiutePakistaniPalestinianPanamanianParaguayanPennsylvania GermanPeruvianPimaPolishPortuguesePotawatomiPuebloPuerto RicanPuget Sound SalishRomanianRussianSalvadoranSamoanScandinavianScotch-IrishScottishSeminoleSenegaleseSerbianShoshoneSierra LeoneanSiouxSlavicSlovakSloveneSomaliSouth AfricanSouth AmericanSouth American IndianSoviet UnionSpaniardSpanishSpanish AmericanSpanish American IndianSri LankanSubsaharan AfricanSudaneseSwedishSwissTaiwaneseThaiTlingit-HaidaTohono O'OdhamTonganTrinidadian and TobagonianTsimshianTurkishU.S. Virgin IslanderUgandanUkrainianUruguayanUteVenezuelanVietnameseWelshWest IndianYakamaYaquiYugoslavianYumanYup'ikZimbabwean
Immigration
NonimmigrantsImmigrantsAfghanistanAfricaAlbaniaArgentinaArmeniaAsiaAustraliaAustriaBahamasBangladeshBarbadosBelarusBelgiumBelizeBoliviaBosnia and HerzegovinaBrazilBulgariaBurma/MyanmarCabo VerdeCambodiaCameroonCanadaCaribbeanCentral AmericaChileChinaColombiaCongoCosta RicaCroatiaCubaCzechoslovakiaDenmarkDominicaDominican RepublicEastern AfricaEastern AsiaEastern EuropeEcuadorEgyptEl SalvadorEnglandEritreaEthiopiaEuropeFijiFranceGermanyGhanaGreeceGrenadaGuatemalaGuyanaHaitiHondurasHong KongHungaryIndiaIndonesiaIranIraqIrelandIsraelItalyJamaicaJapanJordanKazakhstanKenyaKoreaKuwaitLaosLatin AmericaLatviaLebanonLiberiaLithuaniaMalaysiaMexicoMicronesiaMiddle AfricaMoldovaMoroccoNepalNetherlandsNicaraguaNigeriaNorth AmericaNorth MacedoniaNorthern AfricaNorthern EuropeNorwayOceaniaPakistanPanamaPeruPhilippinesPolandPortugalRomaniaRussiaSaudi ArabiaScotlandSenegalSerbiaSierra LeoneSingaporeSomaliaSouth AfricaSouth AmericaSouth Central AsiaSouth Eastern AsiaSouthern EuropeSpainSri LankaSt. Vincent and the GrenadinesSudanSwedenSwitzerlandSyriaTaiwanThailandTrinidad and TobagoTurkeyUgandaUkraineUruguayUzbekistanVenezuelaVietnamWest IndiesWestern AfricaWestern AsiaWestern EuropeYemenZaireZimbabweAzores
Householder Income Ages 25 - 44 years
Income
Poverty
Unemployment
Labor Participation
Family Structure
Vehicle Availability
Education Level
Disability

Householder Income Ages 25 - 44 years Comparison

Syrians

Samoans

Exceptional
Fair
$99,215
HOUSEHOLDER INCOME AGES 25 - 44 YEARS
92.9/ 100
METRIC RATING
118th/ 347
METRIC RANK
$92,385
HOUSEHOLDER INCOME AGES 25 - 44 YEARS
23.0/ 100
METRIC RATING
193rd/ 347
METRIC RANK

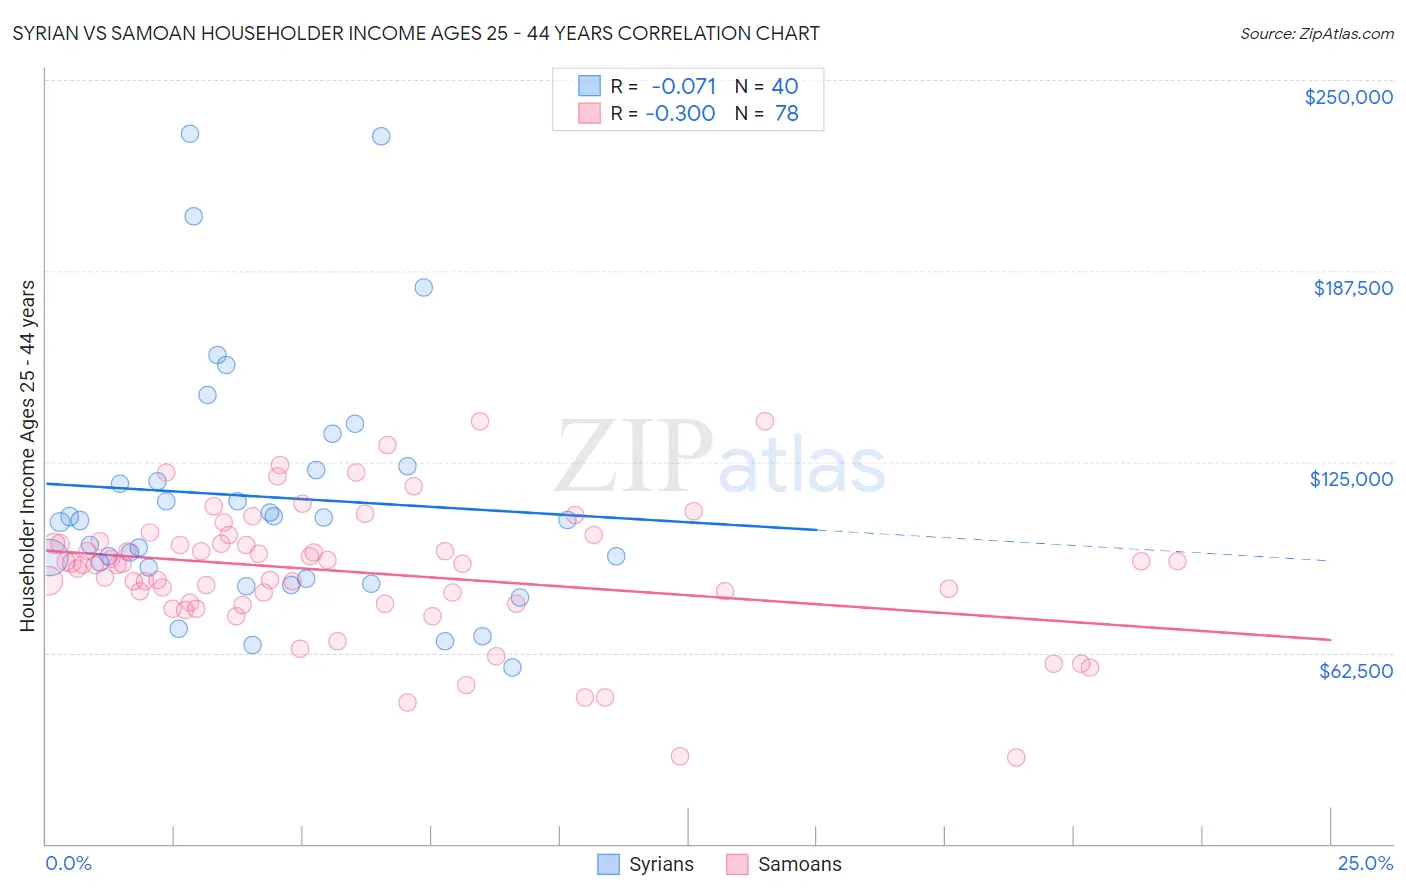
Syrian vs Samoan Householder Income Ages 25 - 44 years Correlation Chart

The statistical analysis conducted on geographies consisting of 265,710,872 people shows a slight negative correlation between the proportion of Syrians and household income with householder between the ages 25 and 44 in the United States with a correlation coefficient (R) of -0.071 and weighted average of $99,215. Similarly, the statistical analysis conducted on geographies consisting of 224,893,183 people shows a mild negative correlation between the proportion of Samoans and household income with householder between the ages 25 and 44 in the United States with a correlation coefficient (R) of -0.300 and weighted average of $92,385, a difference of 7.4%.
Syrian vs Samoan Householder Income Ages 25 - 44 years

Householder Income Ages 25 - 44 years Correlation Summary

MeasurementSyrianSamoan
Minimum$57,774$28,250
Maximum$232,386$138,313
Range$174,612$110,063
Mean$113,575$88,852
Median$105,902$91,500
Interquartile 25% (IQ1)$88,495$78,594
Interquartile 75% (IQ3)$122,954$98,319
Interquartile Range (IQR)$34,460$19,725
Standard Deviation (Sample)$41,385$21,577
Standard Deviation (Population)$40,865$21,438

Similar Demographics by Householder Income Ages 25 - 44 years

Demographics Similar to Syrians by Householder Income Ages 25 - 44 years

In terms of householder income ages 25 - 44 years, the demographic groups most similar to Syrians are Immigrants from Northern Africa ($99,232, a difference of 0.020%), Jordanian ($99,186, a difference of 0.030%), Swedish ($99,136, a difference of 0.080%), Portuguese ($99,429, a difference of 0.22%), and Carpatho Rusyn ($99,449, a difference of 0.24%).
DemographicsRating | RankHouseholder Income Ages 25 - 44 years
Chileans
95.1
/100
|
#111
Exceptional
$99,900
Poles
94.5
/100
|
#112
Exceptional
$99,685
Tongans
94.2
/100
|
#113
Exceptional
$99,604
Immigrants | Western Asia
94.0
/100
|
#114
Exceptional
$99,516
Carpatho Rusyns
93.7
/100
|
#115
Exceptional
$99,449
Portuguese
93.7
/100
|
#116
Exceptional
$99,429
Immigrants | Northern Africa
93.0
/100
|
#117
Exceptional
$99,232
Syrians
92.9
/100
|
#118
Exceptional
$99,215
Jordanians
92.8
/100
|
#119
Exceptional
$99,186
Swedes
92.7
/100
|
#120
Exceptional
$99,136
Peruvians
91.7
/100
|
#121
Exceptional
$98,886
Immigrants | Uzbekistan
91.5
/100
|
#122
Exceptional
$98,849
Palestinians
91.2
/100
|
#123
Exceptional
$98,777
Zimbabweans
90.3
/100
|
#124
Exceptional
$98,586
Pakistanis
89.3
/100
|
#125
Excellent
$98,401

Demographics Similar to Samoans by Householder Income Ages 25 - 44 years

In terms of householder income ages 25 - 44 years, the demographic groups most similar to Samoans are Immigrants from the Azores ($92,322, a difference of 0.070%), Celtic ($92,241, a difference of 0.16%), Immigrants from Colombia ($92,204, a difference of 0.20%), Spanish ($92,200, a difference of 0.20%), and Vietnamese ($92,089, a difference of 0.32%).
DemographicsRating | RankHouseholder Income Ages 25 - 44 years
Sierra Leoneans
34.8
/100
|
#186
Fair
$93,435
Spaniards
34.0
/100
|
#187
Fair
$93,366
Immigrants | Sierra Leone
30.9
/100
|
#188
Fair
$93,115
Dutch
30.5
/100
|
#189
Fair
$93,081
Welsh
30.0
/100
|
#190
Fair
$93,039
Tlingit-Haida
29.4
/100
|
#191
Fair
$92,987
Immigrants | Costa Rica
28.2
/100
|
#192
Fair
$92,876
Samoans
23.0
/100
|
#193
Fair
$92,385
Immigrants | Azores
22.4
/100
|
#194
Fair
$92,322
Celtics
21.6
/100
|
#195
Fair
$92,241
Immigrants | Colombia
21.3
/100
|
#196
Fair
$92,204
Spanish
21.2
/100
|
#197
Fair
$92,200
Vietnamese
20.2
/100
|
#198
Fair
$92,089
Kenyans
16.8
/100
|
#199
Poor
$91,684
Whites/Caucasians
16.7
/100
|
#200
Poor
$91,668