Syrian vs Apache Median Family Income
COMPARE
Syrian
Apache
Median Family Income
Median Family Income Comparison
Syrians
Apache
$109,299
MEDIAN FAMILY INCOME
96.7/ 100
METRIC RATING
105th/ 347
METRIC RANK
$84,451
MEDIAN FAMILY INCOME
0.0/ 100
METRIC RATING
315th/ 347
METRIC RANK
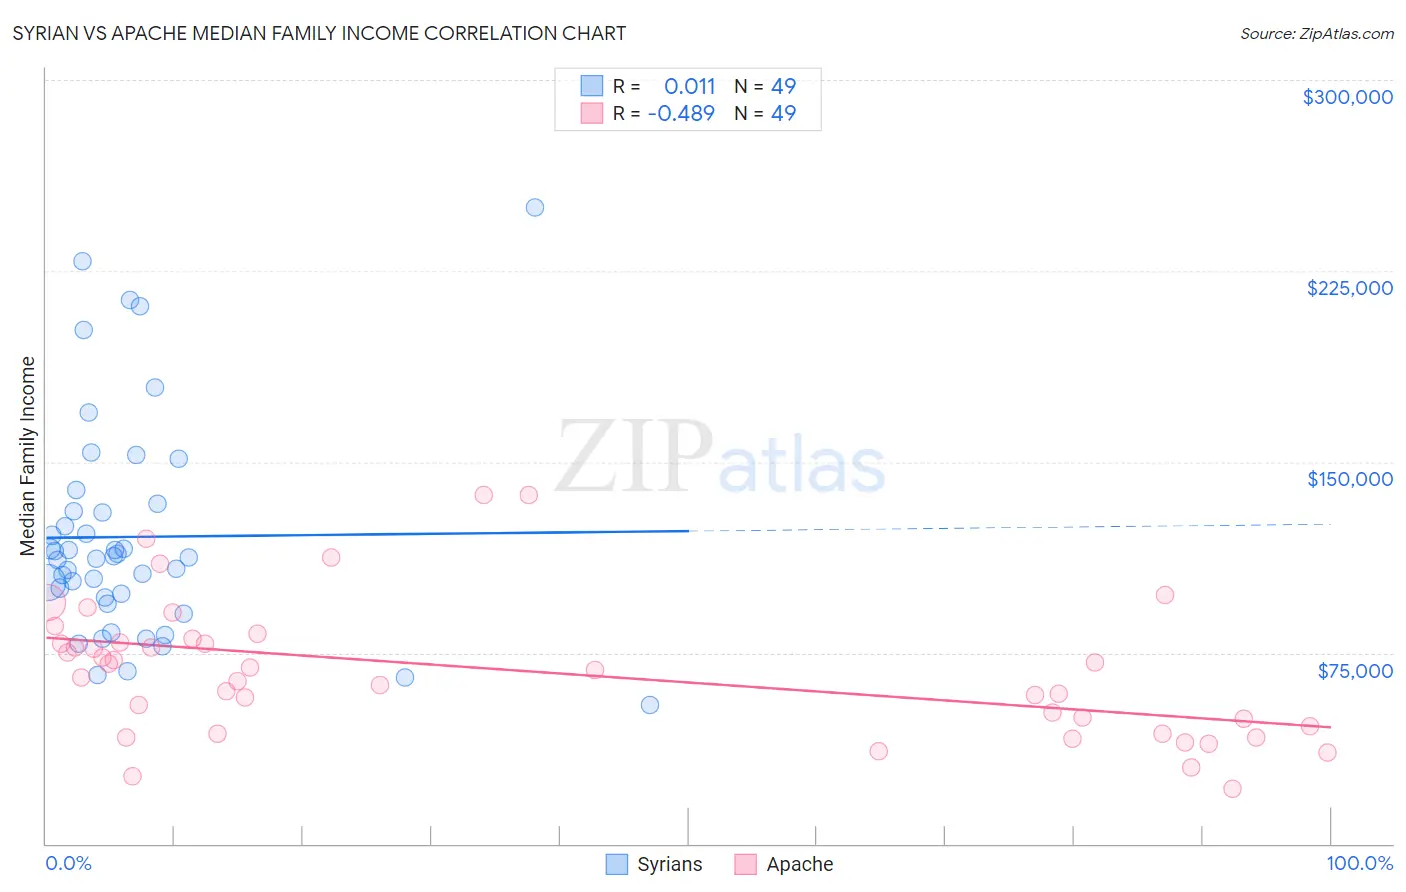
Syrian vs Apache Median Family Income Correlation Chart
The statistical analysis conducted on geographies consisting of 266,121,258 people shows no correlation between the proportion of Syrians and median family income in the United States with a correlation coefficient (R) of 0.011 and weighted average of $109,299. Similarly, the statistical analysis conducted on geographies consisting of 231,007,077 people shows a moderate negative correlation between the proportion of Apache and median family income in the United States with a correlation coefficient (R) of -0.489 and weighted average of $84,451, a difference of 29.4%.
Median Family Income Correlation Summary
| Measurement | Syrian | Apache |
| Minimum | $54,375 | $21,444 |
| Maximum | $250,001 | $136,944 |
| Range | $195,626 | $115,500 |
| Mean | $120,507 | $67,810 |
| Median | $112,639 | $68,015 |
| Interquartile 25% (IQ1) | $95,409 | $44,680 |
| Interquartile 75% (IQ3) | $132,003 | $79,729 |
| Interquartile Range (IQR) | $36,594 | $35,049 |
| Standard Deviation (Sample) | $43,231 | $26,784 |
| Standard Deviation (Population) | $42,788 | $26,510 |
Similar Demographics by Median Family Income
Demographics Similar to Syrians by Median Family Income
In terms of median family income, the demographic groups most similar to Syrians are Palestinian ($109,413, a difference of 0.10%), Immigrants from Brazil ($109,418, a difference of 0.11%), Albanian ($109,136, a difference of 0.15%), Immigrants from North Macedonia ($109,136, a difference of 0.15%), and Assyrian/Chaldean/Syriac ($109,622, a difference of 0.30%).
| Demographics | Rating | Rank | Median Family Income |
| Immigrants | Kuwait | 97.4 /100 | #98 | Exceptional $109,731 |
| Armenians | 97.3 /100 | #99 | Exceptional $109,692 |
| Macedonians | 97.3 /100 | #100 | Exceptional $109,668 |
| Immigrants | Ukraine | 97.2 /100 | #101 | Exceptional $109,645 |
| Assyrians/Chaldeans/Syriacs | 97.2 /100 | #102 | Exceptional $109,622 |
| Immigrants | Brazil | 96.9 /100 | #103 | Exceptional $109,418 |
| Palestinians | 96.9 /100 | #104 | Exceptional $109,413 |
| Syrians | 96.7 /100 | #105 | Exceptional $109,299 |
| Albanians | 96.4 /100 | #106 | Exceptional $109,136 |
| Immigrants | North Macedonia | 96.4 /100 | #107 | Exceptional $109,136 |
| Immigrants | Zimbabwe | 95.9 /100 | #108 | Exceptional $108,830 |
| Immigrants | Afghanistan | 95.6 /100 | #109 | Exceptional $108,709 |
| British | 95.6 /100 | #110 | Exceptional $108,705 |
| Immigrants | Western Asia | 95.6 /100 | #111 | Exceptional $108,691 |
| Immigrants | Poland | 95.3 /100 | #112 | Exceptional $108,570 |
Demographics Similar to Apache by Median Family Income
In terms of median family income, the demographic groups most similar to Apache are Immigrants from Bahamas ($84,732, a difference of 0.33%), Choctaw ($84,835, a difference of 0.45%), Immigrants from Haiti ($84,018, a difference of 0.52%), Yakama ($83,932, a difference of 0.62%), and Cuban ($84,981, a difference of 0.63%).
| Demographics | Rating | Rank | Median Family Income |
| U.S. Virgin Islanders | 0.0 /100 | #308 | Tragic $85,294 |
| Haitians | 0.0 /100 | #309 | Tragic $85,218 |
| Immigrants | Central America | 0.0 /100 | #310 | Tragic $85,050 |
| Hondurans | 0.0 /100 | #311 | Tragic $85,004 |
| Cubans | 0.0 /100 | #312 | Tragic $84,981 |
| Choctaw | 0.0 /100 | #313 | Tragic $84,835 |
| Immigrants | Bahamas | 0.0 /100 | #314 | Tragic $84,732 |
| Apache | 0.0 /100 | #315 | Tragic $84,451 |
| Immigrants | Haiti | 0.0 /100 | #316 | Tragic $84,018 |
| Yakama | 0.0 /100 | #317 | Tragic $83,932 |
| Immigrants | Mexico | 0.0 /100 | #318 | Tragic $83,639 |
| Immigrants | Honduras | 0.0 /100 | #319 | Tragic $83,618 |
| Seminole | 0.0 /100 | #320 | Tragic $83,354 |
| Immigrants | Caribbean | 0.0 /100 | #321 | Tragic $83,319 |
| Dominicans | 0.0 /100 | #322 | Tragic $82,888 |