Swiss vs Slovak Wage/Income Gap
COMPARE
Swiss
Slovak
Wage/Income Gap
Wage/Income Gap Comparison
Swiss
Slovaks
30.0%
WAGE/INCOME GAP
0.0/ 100
METRIC RATING
340th/ 347
METRIC RANK
28.9%
WAGE/INCOME GAP
0.1/ 100
METRIC RATING
319th/ 347
METRIC RANK
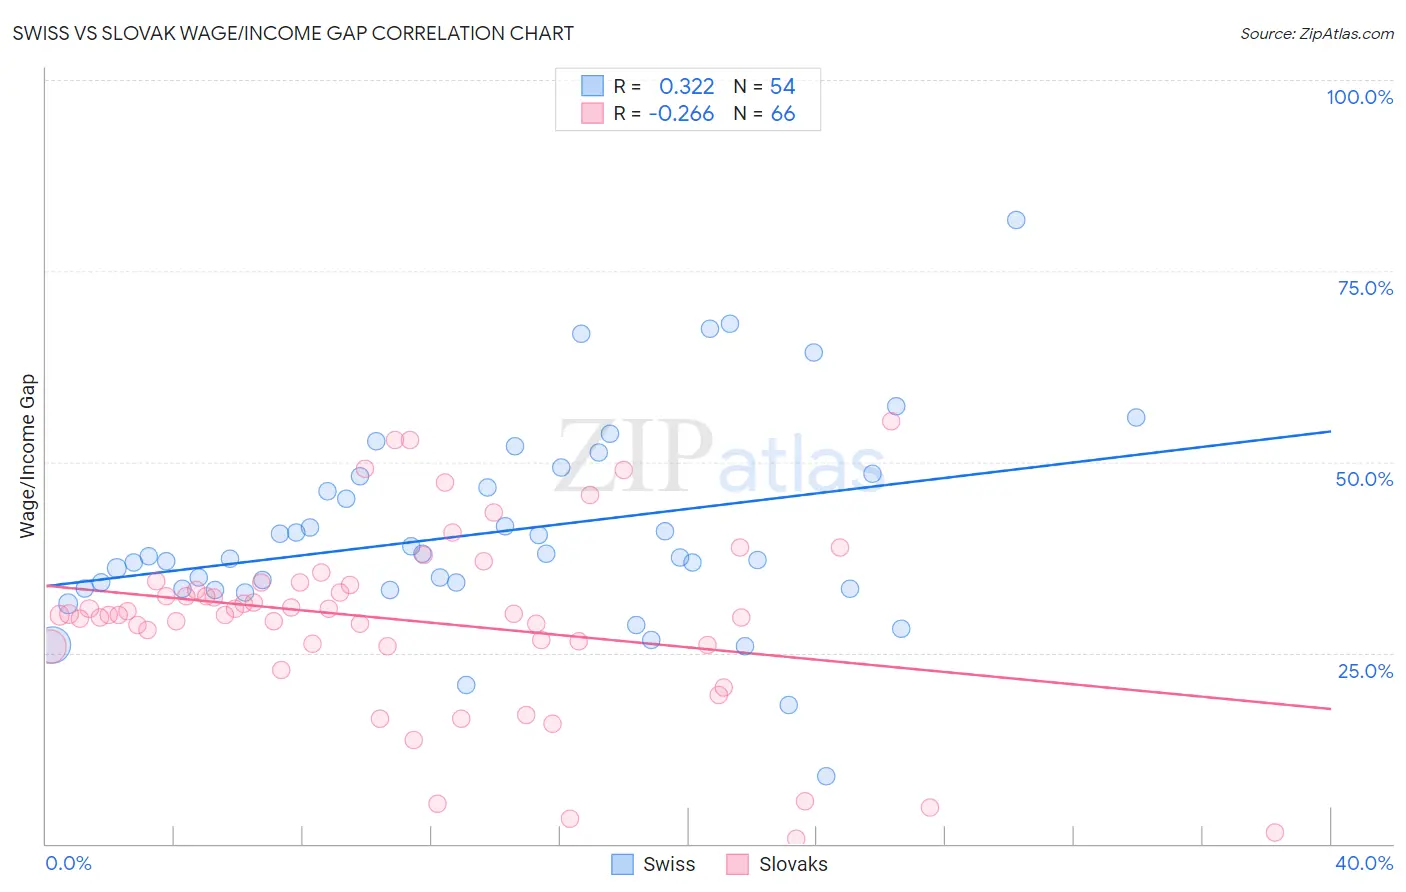
Swiss vs Slovak Wage/Income Gap Correlation Chart
The statistical analysis conducted on geographies consisting of 464,189,171 people shows a mild positive correlation between the proportion of Swiss and wage/income gap percentage in the United States with a correlation coefficient (R) of 0.322 and weighted average of 30.0%. Similarly, the statistical analysis conducted on geographies consisting of 397,444,585 people shows a weak negative correlation between the proportion of Slovaks and wage/income gap percentage in the United States with a correlation coefficient (R) of -0.266 and weighted average of 28.9%, a difference of 3.8%.
Wage/Income Gap Correlation Summary
| Measurement | Swiss | Slovak |
| Minimum | 8.8% | 0.72% |
| Maximum | 81.7% | 55.3% |
| Range | 72.9% | 54.6% |
| Mean | 40.7% | 29.3% |
| Median | 37.6% | 30.0% |
| Interquartile 25% (IQ1) | 33.4% | 26.0% |
| Interquartile 75% (IQ3) | 48.0% | 34.2% |
| Interquartile Range (IQR) | 14.6% | 8.2% |
| Standard Deviation (Sample) | 13.2% | 11.9% |
| Standard Deviation (Population) | 13.1% | 11.8% |
Similar Demographics by Wage/Income Gap
Demographics Similar to Swiss by Wage/Income Gap
In terms of wage/income gap, the demographic groups most similar to Swiss are Iranian (29.7%, a difference of 0.83%), Filipino (29.7%, a difference of 0.89%), Dutch (29.6%, a difference of 1.1%), Thai (30.5%, a difference of 1.7%), and English (29.5%, a difference of 1.7%).
| Demographics | Rating | Rank | Wage/Income Gap |
| Europeans | 0.0 /100 | #333 | Tragic 29.4% |
| Swedes | 0.0 /100 | #334 | Tragic 29.4% |
| Immigrants | Taiwan | 0.0 /100 | #335 | Tragic 29.5% |
| English | 0.0 /100 | #336 | Tragic 29.5% |
| Dutch | 0.0 /100 | #337 | Tragic 29.6% |
| Filipinos | 0.0 /100 | #338 | Tragic 29.7% |
| Iranians | 0.0 /100 | #339 | Tragic 29.7% |
| Swiss | 0.0 /100 | #340 | Tragic 30.0% |
| Thais | 0.0 /100 | #341 | Tragic 30.5% |
| Pennsylvania Germans | 0.0 /100 | #342 | Tragic 30.7% |
| Danes | 0.0 /100 | #343 | Tragic 31.0% |
| Assyrians/Chaldeans/Syriacs | 0.0 /100 | #344 | Tragic 31.0% |
| Immigrants | India | 0.0 /100 | #345 | Tragic 31.5% |
| Cajuns | 0.0 /100 | #346 | Tragic 33.9% |
| Houma | 0.0 /100 | #347 | Tragic 38.7% |
Demographics Similar to Slovaks by Wage/Income Gap
In terms of wage/income gap, the demographic groups most similar to Slovaks are British (28.9%, a difference of 0.060%), Welsh (28.9%, a difference of 0.13%), Immigrants from Singapore (28.9%, a difference of 0.15%), Norwegian (29.0%, a difference of 0.25%), and Basque (28.8%, a difference of 0.31%).
| Demographics | Rating | Rank | Wage/Income Gap |
| Eastern Europeans | 0.1 /100 | #312 | Tragic 28.6% |
| French | 0.1 /100 | #313 | Tragic 28.7% |
| Immigrants | Scotland | 0.1 /100 | #314 | Tragic 28.7% |
| Maltese | 0.1 /100 | #315 | Tragic 28.7% |
| Lithuanians | 0.1 /100 | #316 | Tragic 28.7% |
| Belgians | 0.1 /100 | #317 | Tragic 28.8% |
| Basques | 0.1 /100 | #318 | Tragic 28.8% |
| Slovaks | 0.1 /100 | #319 | Tragic 28.9% |
| British | 0.1 /100 | #320 | Tragic 28.9% |
| Welsh | 0.1 /100 | #321 | Tragic 28.9% |
| Immigrants | Singapore | 0.1 /100 | #322 | Tragic 28.9% |
| Norwegians | 0.1 /100 | #323 | Tragic 29.0% |
| Croatians | 0.0 /100 | #324 | Tragic 29.0% |
| Hungarians | 0.0 /100 | #325 | Tragic 29.0% |
| Immigrants | Belgium | 0.0 /100 | #326 | Tragic 29.0% |