Swiss vs Chinese Householder Income Ages 25 - 44 years
COMPARE
Swiss
Chinese
Householder Income Ages 25 - 44 years
Householder Income Ages 25 - 44 years Comparison
Swiss
Chinese
$95,511
HOUSEHOLDER INCOME AGES 25 - 44 YEARS
62.8/ 100
METRIC RATING
162nd/ 347
METRIC RANK
$104,264
HOUSEHOLDER INCOME AGES 25 - 44 YEARS
99.5/ 100
METRIC RATING
72nd/ 347
METRIC RANK
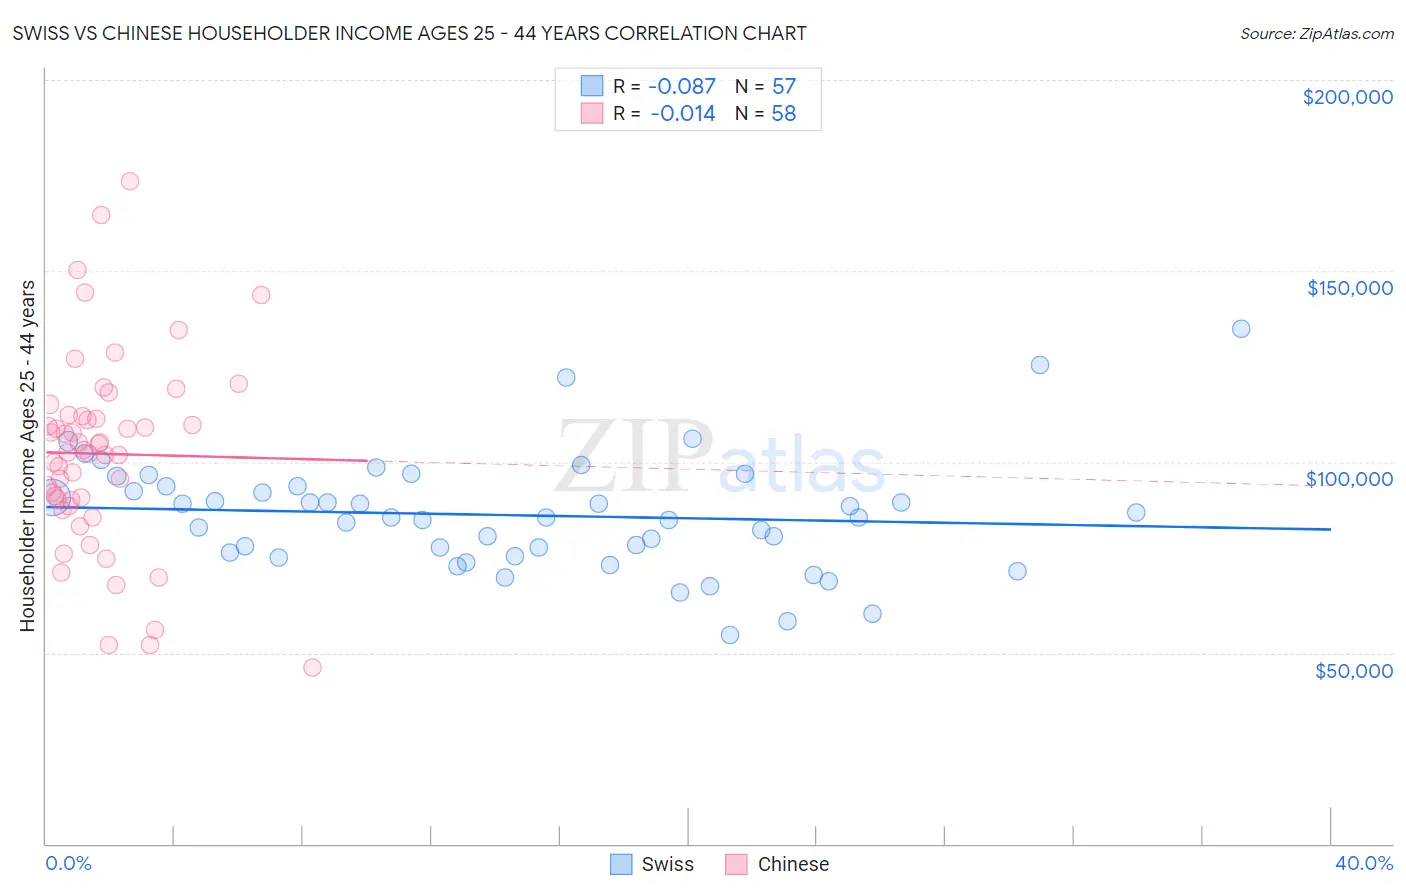
Swiss vs Chinese Householder Income Ages 25 - 44 years Correlation Chart
The statistical analysis conducted on geographies consisting of 463,021,921 people shows a slight negative correlation between the proportion of Swiss and household income with householder between the ages 25 and 44 in the United States with a correlation coefficient (R) of -0.087 and weighted average of $95,511. Similarly, the statistical analysis conducted on geographies consisting of 64,779,032 people shows no correlation between the proportion of Chinese and household income with householder between the ages 25 and 44 in the United States with a correlation coefficient (R) of -0.014 and weighted average of $104,264, a difference of 9.2%.
Householder Income Ages 25 - 44 years Correlation Summary
| Measurement | Swiss | Chinese |
| Minimum | $54,762 | $46,250 |
| Maximum | $135,000 | $173,338 |
| Range | $80,238 | $127,088 |
| Mean | $86,015 | $102,110 |
| Median | $85,408 | $102,775 |
| Interquartile 25% (IQ1) | $75,688 | $90,138 |
| Interquartile 75% (IQ3) | $93,608 | $111,997 |
| Interquartile Range (IQR) | $17,920 | $21,859 |
| Standard Deviation (Sample) | $15,233 | $25,334 |
| Standard Deviation (Population) | $15,098 | $25,115 |
Similar Demographics by Householder Income Ages 25 - 44 years
Demographics Similar to Swiss by Householder Income Ages 25 - 44 years
In terms of householder income ages 25 - 44 years, the demographic groups most similar to Swiss are Immigrants from Portugal ($95,512, a difference of 0.0%), Icelander ($95,560, a difference of 0.050%), Costa Rican ($95,565, a difference of 0.060%), Immigrants from Saudi Arabia ($95,450, a difference of 0.060%), and Scandinavian ($95,596, a difference of 0.090%).
| Demographics | Rating | Rank | Householder Income Ages 25 - 44 years |
| Moroccans | 70.3 /100 | #155 | Good $96,117 |
| Immigrants | Germany | 67.9 /100 | #156 | Good $95,913 |
| Immigrants | Uganda | 65.2 /100 | #157 | Good $95,698 |
| Scandinavians | 63.9 /100 | #158 | Good $95,596 |
| Costa Ricans | 63.5 /100 | #159 | Good $95,565 |
| Icelanders | 63.4 /100 | #160 | Good $95,560 |
| Immigrants | Portugal | 62.8 /100 | #161 | Good $95,512 |
| Swiss | 62.8 /100 | #162 | Good $95,511 |
| Immigrants | Saudi Arabia | 62.0 /100 | #163 | Good $95,450 |
| South Americans | 60.9 /100 | #164 | Good $95,362 |
| Immigrants | Nepal | 60.3 /100 | #165 | Good $95,322 |
| Immigrants | Ethiopia | 59.5 /100 | #166 | Average $95,256 |
| Czechoslovakians | 57.0 /100 | #167 | Average $95,070 |
| Alsatians | 56.8 /100 | #168 | Average $95,059 |
| Native Hawaiians | 56.8 /100 | #169 | Average $95,058 |
Demographics Similar to Chinese by Householder Income Ages 25 - 44 years
In terms of householder income ages 25 - 44 years, the demographic groups most similar to Chinese are Italian ($104,215, a difference of 0.050%), Afghan ($104,410, a difference of 0.14%), Immigrants from Croatia ($104,503, a difference of 0.23%), Mongolian ($104,578, a difference of 0.30%), and Immigrants from Fiji ($103,954, a difference of 0.30%).
| Demographics | Rating | Rank | Householder Income Ages 25 - 44 years |
| Immigrants | Netherlands | 99.7 /100 | #65 | Exceptional $105,082 |
| Laotians | 99.7 /100 | #66 | Exceptional $104,993 |
| Immigrants | Romania | 99.6 /100 | #67 | Exceptional $104,713 |
| Immigrants | Eastern Europe | 99.6 /100 | #68 | Exceptional $104,662 |
| Mongolians | 99.6 /100 | #69 | Exceptional $104,578 |
| Immigrants | Croatia | 99.6 /100 | #70 | Exceptional $104,503 |
| Afghans | 99.6 /100 | #71 | Exceptional $104,410 |
| Chinese | 99.5 /100 | #72 | Exceptional $104,264 |
| Italians | 99.5 /100 | #73 | Exceptional $104,215 |
| Immigrants | Fiji | 99.5 /100 | #74 | Exceptional $103,954 |
| Koreans | 99.4 /100 | #75 | Exceptional $103,824 |
| Immigrants | Spain | 99.4 /100 | #76 | Exceptional $103,752 |
| Immigrants | Southern Europe | 99.3 /100 | #77 | Exceptional $103,486 |
| Immigrants | Bulgaria | 99.3 /100 | #78 | Exceptional $103,423 |
| Armenians | 99.2 /100 | #79 | Exceptional $103,248 |