Swedish vs Sierra Leonean Median Earnings
COMPARE
Swedish
Sierra Leonean
Median Earnings
Median Earnings Comparison
Swedes
Sierra Leoneans
$47,851
MEDIAN EARNINGS
88.0/ 100
METRIC RATING
143rd/ 347
METRIC RANK
$48,286
MEDIAN EARNINGS
93.1/ 100
METRIC RATING
127th/ 347
METRIC RANK
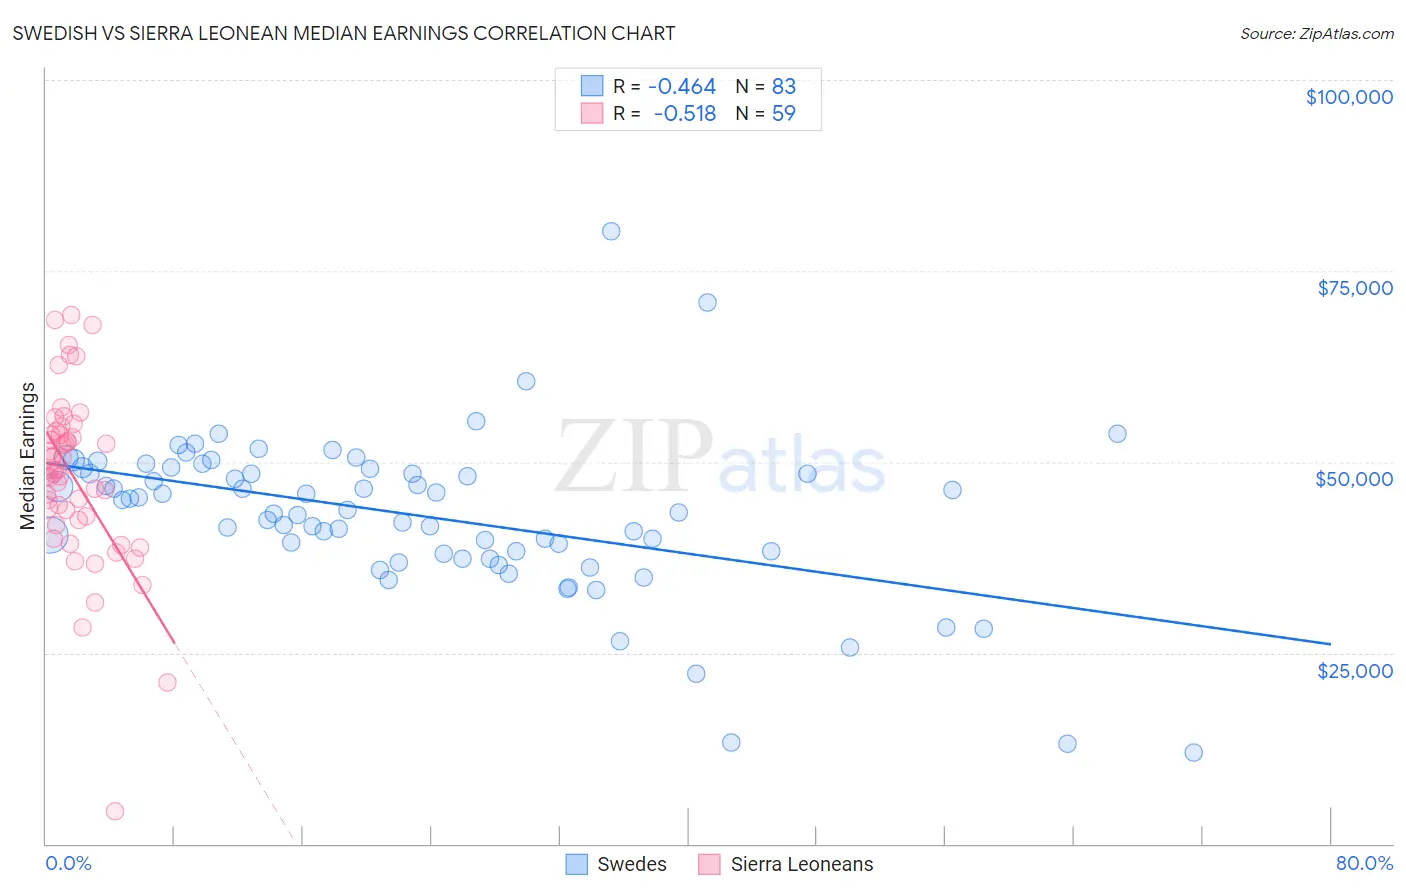
Swedish vs Sierra Leonean Median Earnings Correlation Chart
The statistical analysis conducted on geographies consisting of 538,996,314 people shows a moderate negative correlation between the proportion of Swedes and median earnings in the United States with a correlation coefficient (R) of -0.464 and weighted average of $47,851. Similarly, the statistical analysis conducted on geographies consisting of 83,350,653 people shows a substantial negative correlation between the proportion of Sierra Leoneans and median earnings in the United States with a correlation coefficient (R) of -0.518 and weighted average of $48,286, a difference of 0.91%.
Median Earnings Correlation Summary
| Measurement | Swedish | Sierra Leonean |
| Minimum | $11,875 | $4,235 |
| Maximum | $80,254 | $69,241 |
| Range | $68,379 | $65,006 |
| Mean | $42,935 | $47,947 |
| Median | $43,757 | $48,865 |
| Interquartile 25% (IQ1) | $37,994 | $42,439 |
| Interquartile 75% (IQ3) | $49,030 | $53,466 |
| Interquartile Range (IQR) | $11,035 | $11,027 |
| Standard Deviation (Sample) | $10,532 | $11,282 |
| Standard Deviation (Population) | $10,468 | $11,186 |
Demographics Similar to Swedes and Sierra Leoneans by Median Earnings
In terms of median earnings, the demographic groups most similar to Swedes are Ugandan ($47,854, a difference of 0.010%), Immigrants from Sierra Leone ($47,875, a difference of 0.050%), Taiwanese ($47,902, a difference of 0.11%), Hungarian ($47,795, a difference of 0.12%), and European ($47,915, a difference of 0.13%). Similarly, the demographic groups most similar to Sierra Leoneans are Immigrants from Fiji ($48,305, a difference of 0.040%), Assyrian/Chaldean/Syriac ($48,304, a difference of 0.040%), Immigrants from Philippines ($48,266, a difference of 0.040%), Pakistani ($48,254, a difference of 0.070%), and Zimbabwean ($48,229, a difference of 0.12%).
| Demographics | Rating | Rank | Median Earnings |
| Immigrants | Fiji | 93.3 /100 | #125 | Exceptional $48,305 |
| Assyrians/Chaldeans/Syriacs | 93.3 /100 | #126 | Exceptional $48,304 |
| Sierra Leoneans | 93.1 /100 | #127 | Exceptional $48,286 |
| Immigrants | Philippines | 92.9 /100 | #128 | Exceptional $48,266 |
| Pakistanis | 92.8 /100 | #129 | Exceptional $48,254 |
| Zimbabweans | 92.6 /100 | #130 | Exceptional $48,229 |
| Lebanese | 92.5 /100 | #131 | Exceptional $48,226 |
| British | 92.2 /100 | #132 | Exceptional $48,189 |
| Immigrants | Uganda | 90.5 /100 | #133 | Exceptional $48,041 |
| Sri Lankans | 90.5 /100 | #134 | Exceptional $48,040 |
| Portuguese | 90.4 /100 | #135 | Exceptional $48,032 |
| Slovenes | 90.0 /100 | #136 | Excellent $47,995 |
| Immigrants | Nepal | 89.0 /100 | #137 | Excellent $47,925 |
| Europeans | 88.9 /100 | #138 | Excellent $47,915 |
| Canadians | 88.8 /100 | #139 | Excellent $47,911 |
| Taiwanese | 88.7 /100 | #140 | Excellent $47,902 |
| Immigrants | Sierra Leone | 88.3 /100 | #141 | Excellent $47,875 |
| Ugandans | 88.0 /100 | #142 | Excellent $47,854 |
| Swedes | 88.0 /100 | #143 | Excellent $47,851 |
| Hungarians | 87.1 /100 | #144 | Excellent $47,795 |
| Immigrants | Saudi Arabia | 85.6 /100 | #145 | Excellent $47,704 |