Subsaharan African vs Immigrants from Sri Lanka Median Female Earnings
COMPARE
Subsaharan African
Immigrants from Sri Lanka
Median Female Earnings
Median Female Earnings Comparison
Sub-Saharan Africans
Immigrants from Sri Lanka
$38,391
MEDIAN FEMALE EARNINGS
6.2/ 100
METRIC RATING
228th/ 347
METRIC RANK
$44,161
MEDIAN FEMALE EARNINGS
100.0/ 100
METRIC RATING
35th/ 347
METRIC RANK
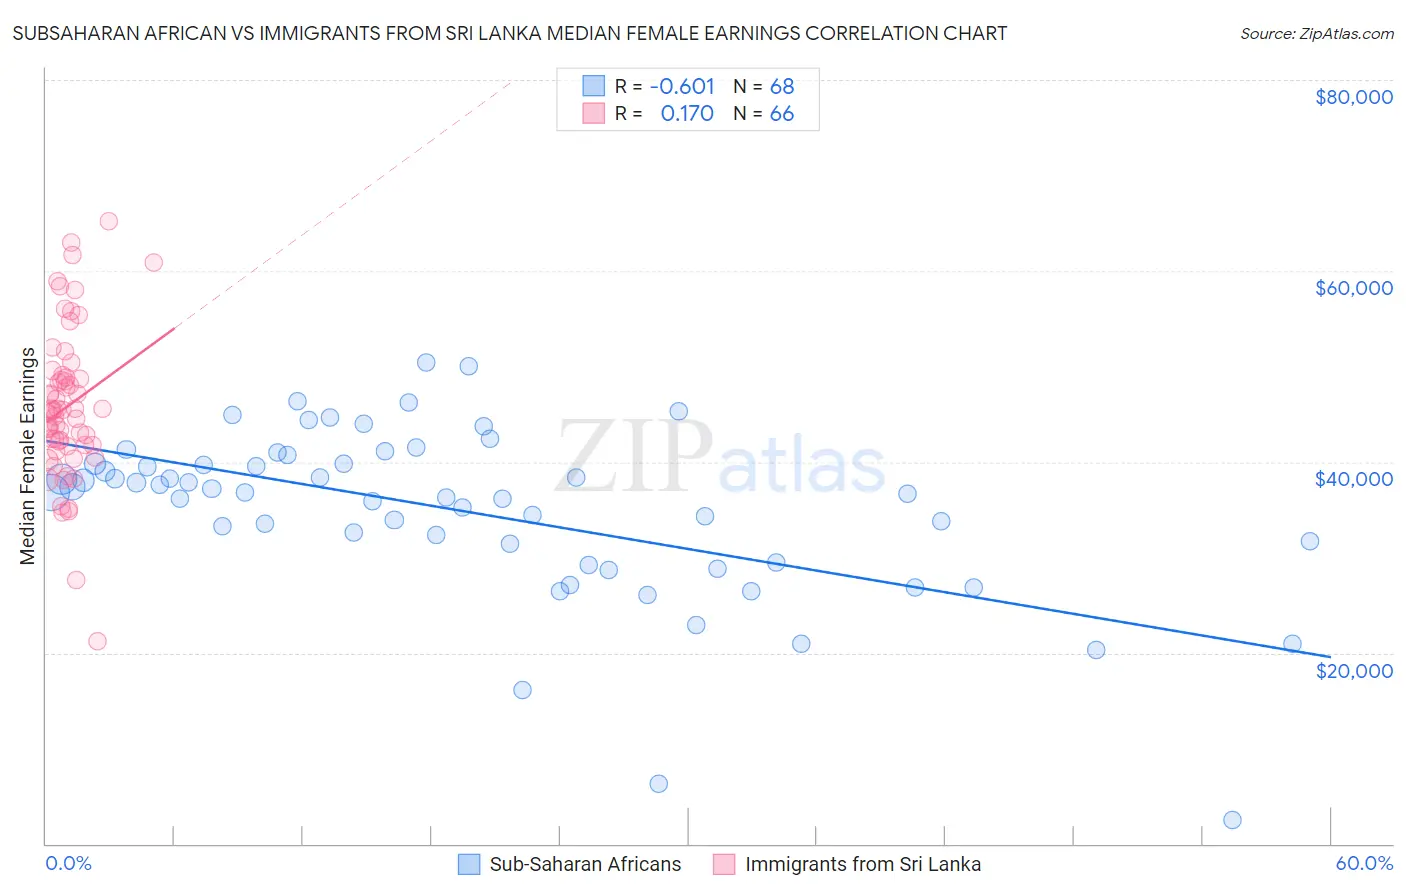
Subsaharan African vs Immigrants from Sri Lanka Median Female Earnings Correlation Chart
The statistical analysis conducted on geographies consisting of 507,707,888 people shows a significant negative correlation between the proportion of Sub-Saharan Africans and median female earnings in the United States with a correlation coefficient (R) of -0.601 and weighted average of $38,391. Similarly, the statistical analysis conducted on geographies consisting of 149,683,911 people shows a poor positive correlation between the proportion of Immigrants from Sri Lanka and median female earnings in the United States with a correlation coefficient (R) of 0.170 and weighted average of $44,161, a difference of 15.0%.
Median Female Earnings Correlation Summary
| Measurement | Subsaharan African | Immigrants from Sri Lanka |
| Minimum | $2,499 | $21,250 |
| Maximum | $50,416 | $65,169 |
| Range | $47,917 | $43,919 |
| Mean | $34,847 | $45,787 |
| Median | $36,829 | $45,387 |
| Interquartile 25% (IQ1) | $30,475 | $41,731 |
| Interquartile 75% (IQ3) | $39,811 | $48,786 |
| Interquartile Range (IQR) | $9,336 | $7,055 |
| Standard Deviation (Sample) | $8,928 | $7,939 |
| Standard Deviation (Population) | $8,863 | $7,878 |
Similar Demographics by Median Female Earnings
Demographics Similar to Sub-Saharan Africans by Median Female Earnings
In terms of median female earnings, the demographic groups most similar to Sub-Saharan Africans are Scottish ($38,397, a difference of 0.020%), Belgian ($38,382, a difference of 0.020%), Basque ($38,352, a difference of 0.10%), French Canadian ($38,436, a difference of 0.12%), and Somali ($38,333, a difference of 0.15%).
| Demographics | Rating | Rank | Median Female Earnings |
| Immigrants | Azores | 8.8 /100 | #221 | Tragic $38,573 |
| Japanese | 8.1 /100 | #222 | Tragic $38,528 |
| Immigrants | Sudan | 7.8 /100 | #223 | Tragic $38,511 |
| Native Hawaiians | 7.1 /100 | #224 | Tragic $38,461 |
| French | 7.0 /100 | #225 | Tragic $38,457 |
| French Canadians | 6.8 /100 | #226 | Tragic $38,436 |
| Scottish | 6.3 /100 | #227 | Tragic $38,397 |
| Sub-Saharan Africans | 6.2 /100 | #228 | Tragic $38,391 |
| Belgians | 6.1 /100 | #229 | Tragic $38,382 |
| Basques | 5.7 /100 | #230 | Tragic $38,352 |
| Somalis | 5.5 /100 | #231 | Tragic $38,333 |
| Scandinavians | 5.2 /100 | #232 | Tragic $38,306 |
| Tongans | 5.1 /100 | #233 | Tragic $38,288 |
| Celtics | 5.0 /100 | #234 | Tragic $38,283 |
| Sudanese | 4.4 /100 | #235 | Tragic $38,215 |
Demographics Similar to Immigrants from Sri Lanka by Median Female Earnings
In terms of median female earnings, the demographic groups most similar to Immigrants from Sri Lanka are Russian ($44,169, a difference of 0.020%), Immigrants from Asia ($44,198, a difference of 0.080%), Immigrants from Turkey ($44,066, a difference of 0.21%), Immigrants from Switzerland ($43,996, a difference of 0.37%), and Immigrants from Northern Europe ($44,366, a difference of 0.46%).
| Demographics | Rating | Rank | Median Female Earnings |
| Immigrants | Russia | 100.0 /100 | #28 | Exceptional $44,680 |
| Immigrants | Belgium | 100.0 /100 | #29 | Exceptional $44,587 |
| Asians | 100.0 /100 | #30 | Exceptional $44,586 |
| Immigrants | France | 100.0 /100 | #31 | Exceptional $44,541 |
| Immigrants | Northern Europe | 100.0 /100 | #32 | Exceptional $44,366 |
| Immigrants | Asia | 100.0 /100 | #33 | Exceptional $44,198 |
| Russians | 100.0 /100 | #34 | Exceptional $44,169 |
| Immigrants | Sri Lanka | 100.0 /100 | #35 | Exceptional $44,161 |
| Immigrants | Turkey | 100.0 /100 | #36 | Exceptional $44,066 |
| Immigrants | Switzerland | 100.0 /100 | #37 | Exceptional $43,996 |
| Latvians | 100.0 /100 | #38 | Exceptional $43,941 |
| Israelis | 100.0 /100 | #39 | Exceptional $43,852 |
| Immigrants | Malaysia | 100.0 /100 | #40 | Exceptional $43,835 |
| Bhutanese | 100.0 /100 | #41 | Exceptional $43,648 |
| Immigrants | Denmark | 100.0 /100 | #42 | Exceptional $43,646 |