Sri Lankan vs Colombian Median Earnings
COMPARE
Sri Lankan
Colombian
Median Earnings
Median Earnings Comparison
Sri Lankans
Colombians
$48,040
MEDIAN EARNINGS
90.5/ 100
METRIC RATING
134th/ 347
METRIC RANK
$46,349
MEDIAN EARNINGS
47.1/ 100
METRIC RATING
178th/ 347
METRIC RANK
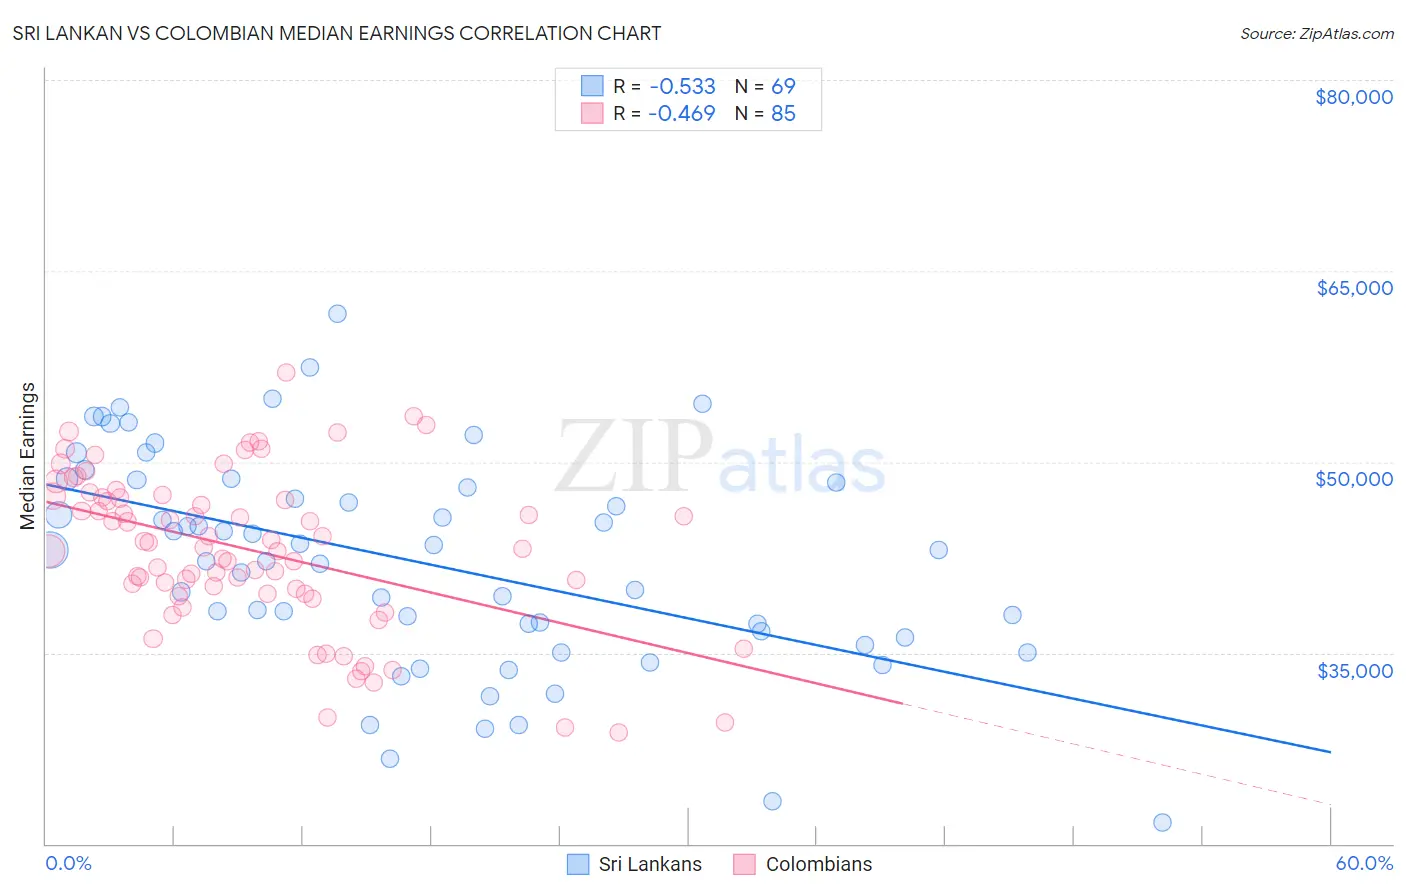
Sri Lankan vs Colombian Median Earnings Correlation Chart
The statistical analysis conducted on geographies consisting of 440,583,083 people shows a substantial negative correlation between the proportion of Sri Lankans and median earnings in the United States with a correlation coefficient (R) of -0.533 and weighted average of $48,040. Similarly, the statistical analysis conducted on geographies consisting of 419,670,347 people shows a moderate negative correlation between the proportion of Colombians and median earnings in the United States with a correlation coefficient (R) of -0.469 and weighted average of $46,349, a difference of 3.6%.
Median Earnings Correlation Summary
| Measurement | Sri Lankan | Colombian |
| Minimum | $21,667 | $28,750 |
| Maximum | $61,651 | $57,032 |
| Range | $39,984 | $28,282 |
| Mean | $42,190 | $43,048 |
| Median | $43,063 | $43,271 |
| Interquartile 25% (IQ1) | $36,459 | $39,637 |
| Interquartile 75% (IQ3) | $48,491 | $47,254 |
| Interquartile Range (IQR) | $12,032 | $7,617 |
| Standard Deviation (Sample) | $8,385 | $6,158 |
| Standard Deviation (Population) | $8,324 | $6,121 |
Similar Demographics by Median Earnings
Demographics Similar to Sri Lankans by Median Earnings
In terms of median earnings, the demographic groups most similar to Sri Lankans are Immigrants from Uganda ($48,041, a difference of 0.0%), Portuguese ($48,032, a difference of 0.020%), Slovene ($47,995, a difference of 0.090%), Immigrants from Nepal ($47,925, a difference of 0.24%), and European ($47,915, a difference of 0.26%).
| Demographics | Rating | Rank | Median Earnings |
| Sierra Leoneans | 93.1 /100 | #127 | Exceptional $48,286 |
| Immigrants | Philippines | 92.9 /100 | #128 | Exceptional $48,266 |
| Pakistanis | 92.8 /100 | #129 | Exceptional $48,254 |
| Zimbabweans | 92.6 /100 | #130 | Exceptional $48,229 |
| Lebanese | 92.5 /100 | #131 | Exceptional $48,226 |
| British | 92.2 /100 | #132 | Exceptional $48,189 |
| Immigrants | Uganda | 90.5 /100 | #133 | Exceptional $48,041 |
| Sri Lankans | 90.5 /100 | #134 | Exceptional $48,040 |
| Portuguese | 90.4 /100 | #135 | Exceptional $48,032 |
| Slovenes | 90.0 /100 | #136 | Excellent $47,995 |
| Immigrants | Nepal | 89.0 /100 | #137 | Excellent $47,925 |
| Europeans | 88.9 /100 | #138 | Excellent $47,915 |
| Canadians | 88.8 /100 | #139 | Excellent $47,911 |
| Taiwanese | 88.7 /100 | #140 | Excellent $47,902 |
| Immigrants | Sierra Leone | 88.3 /100 | #141 | Excellent $47,875 |
Demographics Similar to Colombians by Median Earnings
In terms of median earnings, the demographic groups most similar to Colombians are English ($46,334, a difference of 0.030%), Puget Sound Salish ($46,333, a difference of 0.040%), Immigrants from Cameroon ($46,329, a difference of 0.040%), Belgian ($46,375, a difference of 0.060%), and Swiss ($46,315, a difference of 0.070%).
| Demographics | Rating | Rank | Median Earnings |
| Scottish | 51.1 /100 | #171 | Average $46,463 |
| Kenyans | 51.0 /100 | #172 | Average $46,462 |
| Ghanaians | 50.3 /100 | #173 | Average $46,440 |
| Scandinavians | 50.0 /100 | #174 | Average $46,433 |
| Basques | 48.8 /100 | #175 | Average $46,399 |
| Danes | 48.6 /100 | #176 | Average $46,392 |
| Belgians | 48.0 /100 | #177 | Average $46,375 |
| Colombians | 47.1 /100 | #178 | Average $46,349 |
| English | 46.5 /100 | #179 | Average $46,334 |
| Puget Sound Salish | 46.5 /100 | #180 | Average $46,333 |
| Immigrants | Cameroon | 46.4 /100 | #181 | Average $46,329 |
| Swiss | 45.9 /100 | #182 | Average $46,315 |
| French | 45.2 /100 | #183 | Average $46,296 |
| Immigrants | Kenya | 42.4 /100 | #184 | Average $46,214 |
| Uruguayans | 41.6 /100 | #185 | Average $46,190 |