Spanish vs Immigrants from Ghana Median Earnings
COMPARE
Spanish
Immigrants from Ghana
Median Earnings
Median Earnings Comparison
Spanish
Immigrants from Ghana
$45,432
MEDIAN EARNINGS
19.7/ 100
METRIC RATING
218th/ 347
METRIC RANK
$45,641
MEDIAN EARNINGS
24.8/ 100
METRIC RATING
206th/ 347
METRIC RANK
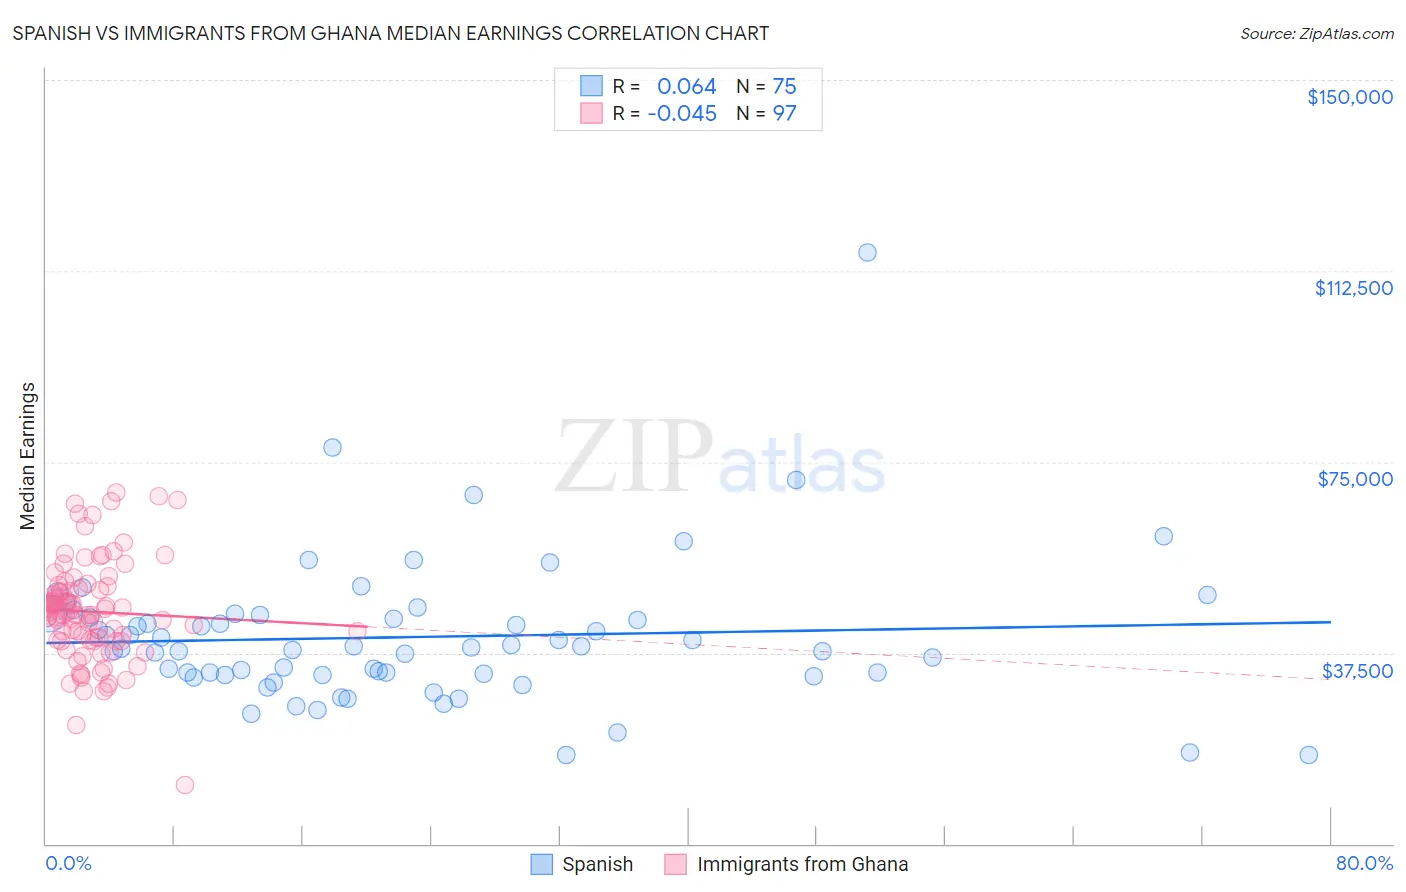
Spanish vs Immigrants from Ghana Median Earnings Correlation Chart
The statistical analysis conducted on geographies consisting of 422,139,772 people shows a slight positive correlation between the proportion of Spanish and median earnings in the United States with a correlation coefficient (R) of 0.064 and weighted average of $45,432. Similarly, the statistical analysis conducted on geographies consisting of 199,945,483 people shows no correlation between the proportion of Immigrants from Ghana and median earnings in the United States with a correlation coefficient (R) of -0.045 and weighted average of $45,641, a difference of 0.46%.
Median Earnings Correlation Summary
| Measurement | Spanish | Immigrants from Ghana |
| Minimum | $17,367 | $11,479 |
| Maximum | $116,081 | $69,009 |
| Range | $98,714 | $57,530 |
| Mean | $40,595 | $45,584 |
| Median | $38,434 | $45,406 |
| Interquartile 25% (IQ1) | $33,070 | $39,912 |
| Interquartile 75% (IQ3) | $44,875 | $50,257 |
| Interquartile Range (IQR) | $11,804 | $10,345 |
| Standard Deviation (Sample) | $14,293 | $10,012 |
| Standard Deviation (Population) | $14,198 | $9,960 |
Demographics Similar to Spanish and Immigrants from Ghana by Median Earnings
In terms of median earnings, the demographic groups most similar to Spanish are Guyanese ($45,470, a difference of 0.080%), Tlingit-Haida ($45,468, a difference of 0.080%), Dutch ($45,370, a difference of 0.14%), Nigerian ($45,532, a difference of 0.22%), and Immigrants from Bangladesh ($45,532, a difference of 0.22%). Similarly, the demographic groups most similar to Immigrants from Ghana are Tongan ($45,665, a difference of 0.050%), Immigrants from Senegal ($45,611, a difference of 0.070%), Immigrants from Uruguay ($45,682, a difference of 0.090%), Immigrants from Bosnia and Herzegovina ($45,600, a difference of 0.090%), and Immigrants from Thailand ($45,598, a difference of 0.10%).
| Demographics | Rating | Rank | Median Earnings |
| Immigrants | Trinidad and Tobago | 27.1 /100 | #202 | Fair $45,729 |
| Welsh | 26.6 /100 | #203 | Fair $45,710 |
| Immigrants | Uruguay | 25.9 /100 | #204 | Fair $45,682 |
| Tongans | 25.4 /100 | #205 | Fair $45,665 |
| Immigrants | Ghana | 24.8 /100 | #206 | Fair $45,641 |
| Immigrants | Senegal | 24.0 /100 | #207 | Fair $45,611 |
| Immigrants | Bosnia and Herzegovina | 23.7 /100 | #208 | Fair $45,600 |
| Immigrants | Thailand | 23.7 /100 | #209 | Fair $45,598 |
| Immigrants | Grenada | 23.6 /100 | #210 | Fair $45,596 |
| Panamanians | 23.5 /100 | #211 | Fair $45,593 |
| Bermudans | 23.5 /100 | #212 | Fair $45,593 |
| Immigrants | Colombia | 22.4 /100 | #213 | Fair $45,550 |
| Nigerians | 22.0 /100 | #214 | Fair $45,532 |
| Immigrants | Bangladesh | 22.0 /100 | #215 | Fair $45,532 |
| Guyanese | 20.6 /100 | #216 | Fair $45,470 |
| Tlingit-Haida | 20.5 /100 | #217 | Fair $45,468 |
| Spanish | 19.7 /100 | #218 | Poor $45,432 |
| Dutch | 18.4 /100 | #219 | Poor $45,370 |
| Ecuadorians | 15.3 /100 | #220 | Poor $45,214 |
| Immigrants | Guyana | 15.1 /100 | #221 | Poor $45,204 |
| Immigrants | Panama | 15.0 /100 | #222 | Poor $45,198 |