Spanish American Indian vs Somali Median Household Income
COMPARE
Spanish American Indian
Somali
Median Household Income
Median Household Income Comparison
Spanish American Indians
Somalis
$76,670
MEDIAN HOUSEHOLD INCOME
0.4/ 100
METRIC RATING
259th/ 347
METRIC RANK
$75,782
MEDIAN HOUSEHOLD INCOME
0.3/ 100
METRIC RATING
272nd/ 347
METRIC RANK
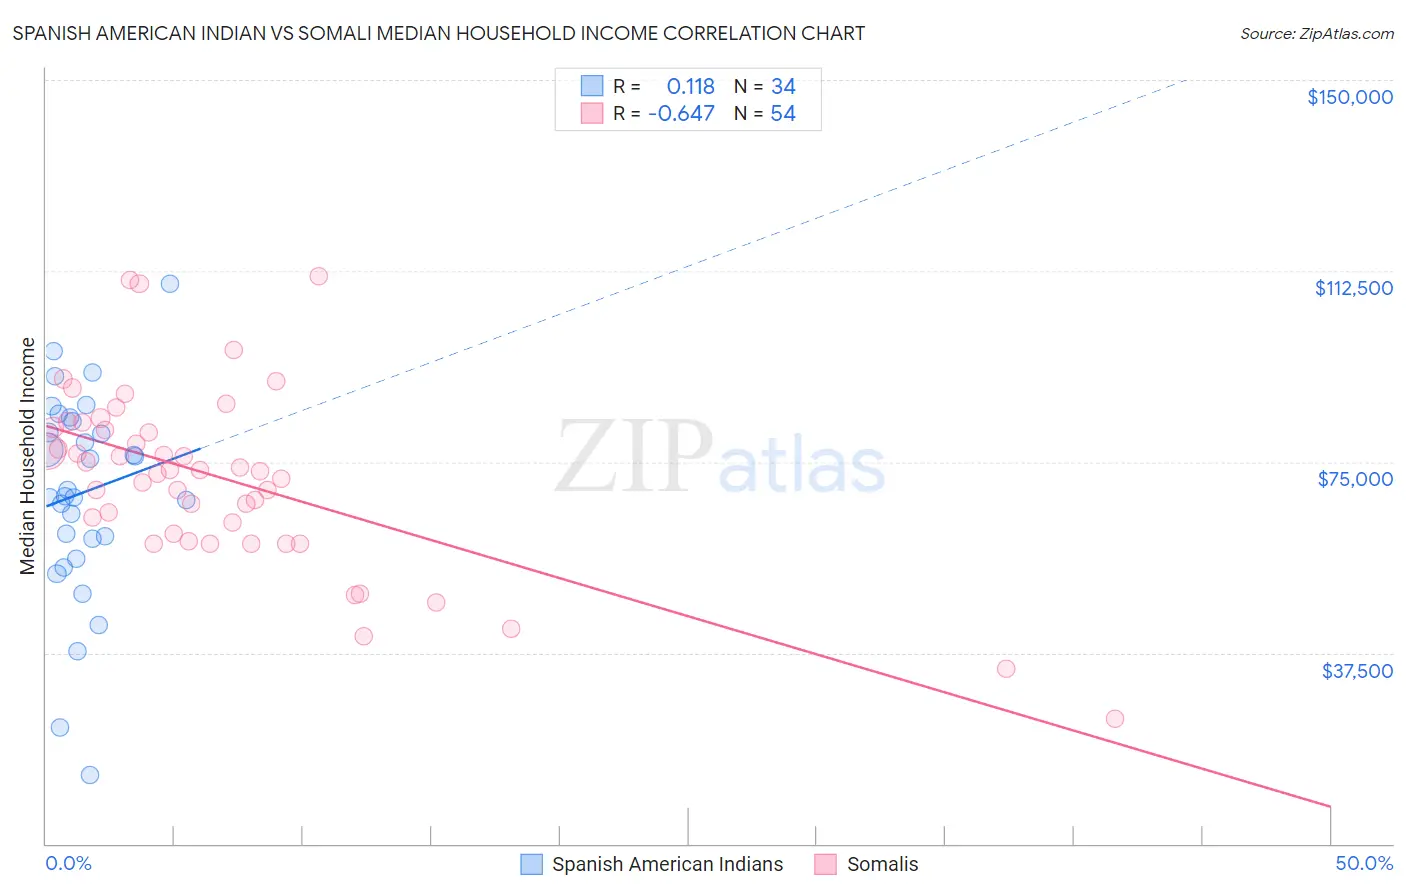
Spanish American Indian vs Somali Median Household Income Correlation Chart
The statistical analysis conducted on geographies consisting of 73,142,507 people shows a poor positive correlation between the proportion of Spanish American Indians and median household income in the United States with a correlation coefficient (R) of 0.118 and weighted average of $76,670. Similarly, the statistical analysis conducted on geographies consisting of 99,284,368 people shows a significant negative correlation between the proportion of Somalis and median household income in the United States with a correlation coefficient (R) of -0.647 and weighted average of $75,782, a difference of 1.2%.
Median Household Income Correlation Summary
| Measurement | Spanish American Indian | Somali |
| Minimum | $13,474 | $24,660 |
| Maximum | $110,000 | $111,550 |
| Range | $96,526 | $86,890 |
| Mean | $68,921 | $71,854 |
| Median | $68,901 | $73,292 |
| Interquartile 25% (IQ1) | $59,929 | $60,808 |
| Interquartile 75% (IQ3) | $82,889 | $81,847 |
| Interquartile Range (IQR) | $22,960 | $21,039 |
| Standard Deviation (Sample) | $20,226 | $17,515 |
| Standard Deviation (Population) | $19,926 | $17,352 |
Demographics Similar to Spanish American Indians and Somalis by Median Household Income
In terms of median household income, the demographic groups most similar to Spanish American Indians are Jamaican ($76,583, a difference of 0.11%), Immigrants from Nicaragua ($76,784, a difference of 0.15%), Immigrants from Grenada ($76,517, a difference of 0.20%), Immigrants from Senegal ($76,915, a difference of 0.32%), and French American Indian ($76,387, a difference of 0.37%). Similarly, the demographic groups most similar to Somalis are Pennsylvania German ($75,814, a difference of 0.040%), Hmong ($75,839, a difference of 0.080%), Immigrants from Jamaica ($75,851, a difference of 0.090%), Cape Verdean ($75,848, a difference of 0.090%), and German Russian ($75,856, a difference of 0.10%).
| Demographics | Rating | Rank | Median Household Income |
| Immigrants | Middle Africa | 0.8 /100 | #255 | Tragic $77,559 |
| Belizeans | 0.6 /100 | #256 | Tragic $77,028 |
| Immigrants | Senegal | 0.5 /100 | #257 | Tragic $76,915 |
| Immigrants | Nicaragua | 0.5 /100 | #258 | Tragic $76,784 |
| Spanish American Indians | 0.4 /100 | #259 | Tragic $76,670 |
| Jamaicans | 0.4 /100 | #260 | Tragic $76,583 |
| Immigrants | Grenada | 0.4 /100 | #261 | Tragic $76,517 |
| French American Indians | 0.4 /100 | #262 | Tragic $76,387 |
| Alaskan Athabascans | 0.4 /100 | #263 | Tragic $76,383 |
| Guatemalans | 0.3 /100 | #264 | Tragic $75,961 |
| Immigrants | Belize | 0.3 /100 | #265 | Tragic $75,938 |
| Americans | 0.3 /100 | #266 | Tragic $75,932 |
| German Russians | 0.3 /100 | #267 | Tragic $75,856 |
| Immigrants | Jamaica | 0.3 /100 | #268 | Tragic $75,851 |
| Cape Verdeans | 0.3 /100 | #269 | Tragic $75,848 |
| Hmong | 0.3 /100 | #270 | Tragic $75,839 |
| Pennsylvania Germans | 0.3 /100 | #271 | Tragic $75,814 |
| Somalis | 0.3 /100 | #272 | Tragic $75,782 |
| Liberians | 0.2 /100 | #273 | Tragic $75,667 |
| British West Indians | 0.2 /100 | #274 | Tragic $75,647 |
| Immigrants | Micronesia | 0.2 /100 | #275 | Tragic $75,574 |