Spanish American Indian vs Pennsylvania German Median Earnings
COMPARE
Spanish American Indian
Pennsylvania German
Median Earnings
Median Earnings Comparison
Spanish American Indians
Pennsylvania Germans
$38,907
MEDIAN EARNINGS
0.0/ 100
METRIC RATING
334th/ 347
METRIC RANK
$42,615
MEDIAN EARNINGS
0.5/ 100
METRIC RATING
271st/ 347
METRIC RANK
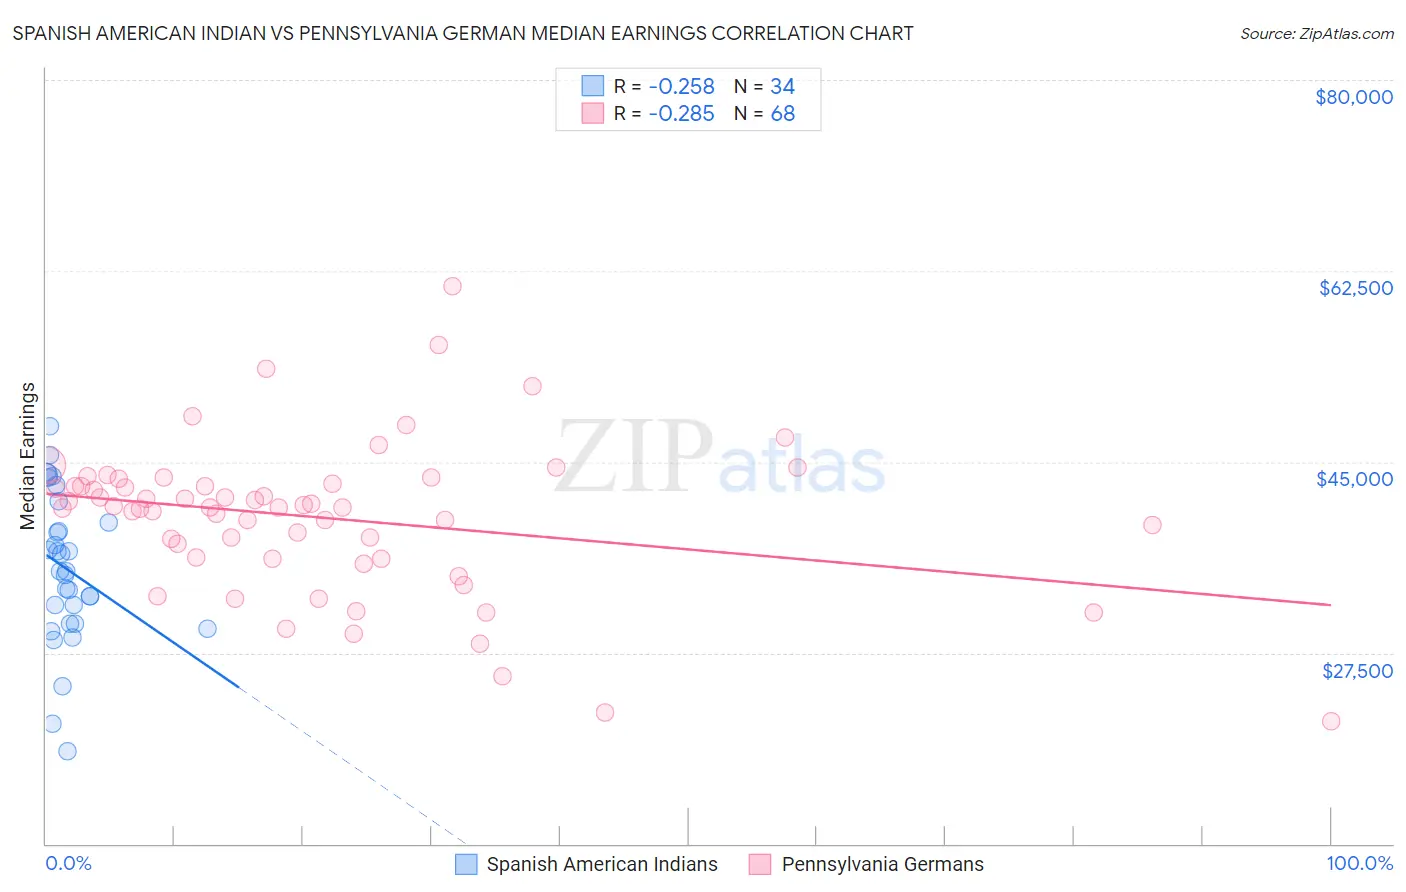
Spanish American Indian vs Pennsylvania German Median Earnings Correlation Chart
The statistical analysis conducted on geographies consisting of 73,148,786 people shows a weak negative correlation between the proportion of Spanish American Indians and median earnings in the United States with a correlation coefficient (R) of -0.258 and weighted average of $38,907. Similarly, the statistical analysis conducted on geographies consisting of 234,087,071 people shows a weak negative correlation between the proportion of Pennsylvania Germans and median earnings in the United States with a correlation coefficient (R) of -0.285 and weighted average of $42,615, a difference of 9.5%.
Median Earnings Correlation Summary
| Measurement | Spanish American Indian | Pennsylvania German |
| Minimum | $18,469 | $21,250 |
| Maximum | $48,281 | $61,146 |
| Range | $29,812 | $39,896 |
| Mean | $35,173 | $39,881 |
| Median | $34,974 | $40,836 |
| Interquartile 25% (IQ1) | $30,208 | $36,214 |
| Interquartile 75% (IQ3) | $39,452 | $42,893 |
| Interquartile Range (IQR) | $9,244 | $6,679 |
| Standard Deviation (Sample) | $6,885 | $6,983 |
| Standard Deviation (Population) | $6,783 | $6,932 |
Similar Demographics by Median Earnings
Demographics Similar to Spanish American Indians by Median Earnings
In terms of median earnings, the demographic groups most similar to Spanish American Indians are Native/Alaskan ($38,896, a difference of 0.030%), Houma ($38,949, a difference of 0.11%), Yakama ($39,107, a difference of 0.52%), Crow ($38,707, a difference of 0.52%), and Immigrants from Mexico ($39,114, a difference of 0.53%).
| Demographics | Rating | Rank | Median Earnings |
| Yuman | 0.0 /100 | #327 | Tragic $39,523 |
| Sioux | 0.0 /100 | #328 | Tragic $39,448 |
| Kiowa | 0.0 /100 | #329 | Tragic $39,232 |
| Immigrants | Congo | 0.0 /100 | #330 | Tragic $39,169 |
| Immigrants | Mexico | 0.0 /100 | #331 | Tragic $39,114 |
| Yakama | 0.0 /100 | #332 | Tragic $39,107 |
| Houma | 0.0 /100 | #333 | Tragic $38,949 |
| Spanish American Indians | 0.0 /100 | #334 | Tragic $38,907 |
| Natives/Alaskans | 0.0 /100 | #335 | Tragic $38,896 |
| Crow | 0.0 /100 | #336 | Tragic $38,707 |
| Immigrants | Cuba | 0.0 /100 | #337 | Tragic $38,426 |
| Pima | 0.0 /100 | #338 | Tragic $38,285 |
| Menominee | 0.0 /100 | #339 | Tragic $37,884 |
| Navajo | 0.0 /100 | #340 | Tragic $36,999 |
| Lumbee | 0.0 /100 | #341 | Tragic $36,876 |
Demographics Similar to Pennsylvania Germans by Median Earnings
In terms of median earnings, the demographic groups most similar to Pennsylvania Germans are Osage ($42,651, a difference of 0.090%), Belizean ($42,702, a difference of 0.21%), American ($42,742, a difference of 0.30%), Cree ($42,777, a difference of 0.38%), and Iroquois ($42,430, a difference of 0.43%).
| Demographics | Rating | Rank | Median Earnings |
| Immigrants | Liberia | 0.7 /100 | #264 | Tragic $42,923 |
| Salvadorans | 0.7 /100 | #265 | Tragic $42,912 |
| Immigrants | Laos | 0.7 /100 | #266 | Tragic $42,884 |
| Cree | 0.6 /100 | #267 | Tragic $42,777 |
| Americans | 0.6 /100 | #268 | Tragic $42,742 |
| Belizeans | 0.5 /100 | #269 | Tragic $42,702 |
| Osage | 0.5 /100 | #270 | Tragic $42,651 |
| Pennsylvania Germans | 0.5 /100 | #271 | Tragic $42,615 |
| Iroquois | 0.4 /100 | #272 | Tragic $42,430 |
| Immigrants | Dominica | 0.4 /100 | #273 | Tragic $42,420 |
| Immigrants | El Salvador | 0.4 /100 | #274 | Tragic $42,413 |
| Immigrants | Belize | 0.3 /100 | #275 | Tragic $42,339 |
| Spanish Americans | 0.3 /100 | #276 | Tragic $42,316 |
| Central Americans | 0.3 /100 | #277 | Tragic $42,280 |
| Cajuns | 0.3 /100 | #278 | Tragic $42,189 |