Spanish American Indian vs Central American Indian Householder Income Ages 25 - 44 years
COMPARE
Spanish American Indian
Central American Indian
Householder Income Ages 25 - 44 years
Householder Income Ages 25 - 44 years Comparison
Spanish American Indians
Central American Indians
$84,085
HOUSEHOLDER INCOME AGES 25 - 44 YEARS
0.3/ 100
METRIC RATING
269th/ 347
METRIC RANK
$82,355
HOUSEHOLDER INCOME AGES 25 - 44 YEARS
0.1/ 100
METRIC RATING
282nd/ 347
METRIC RANK
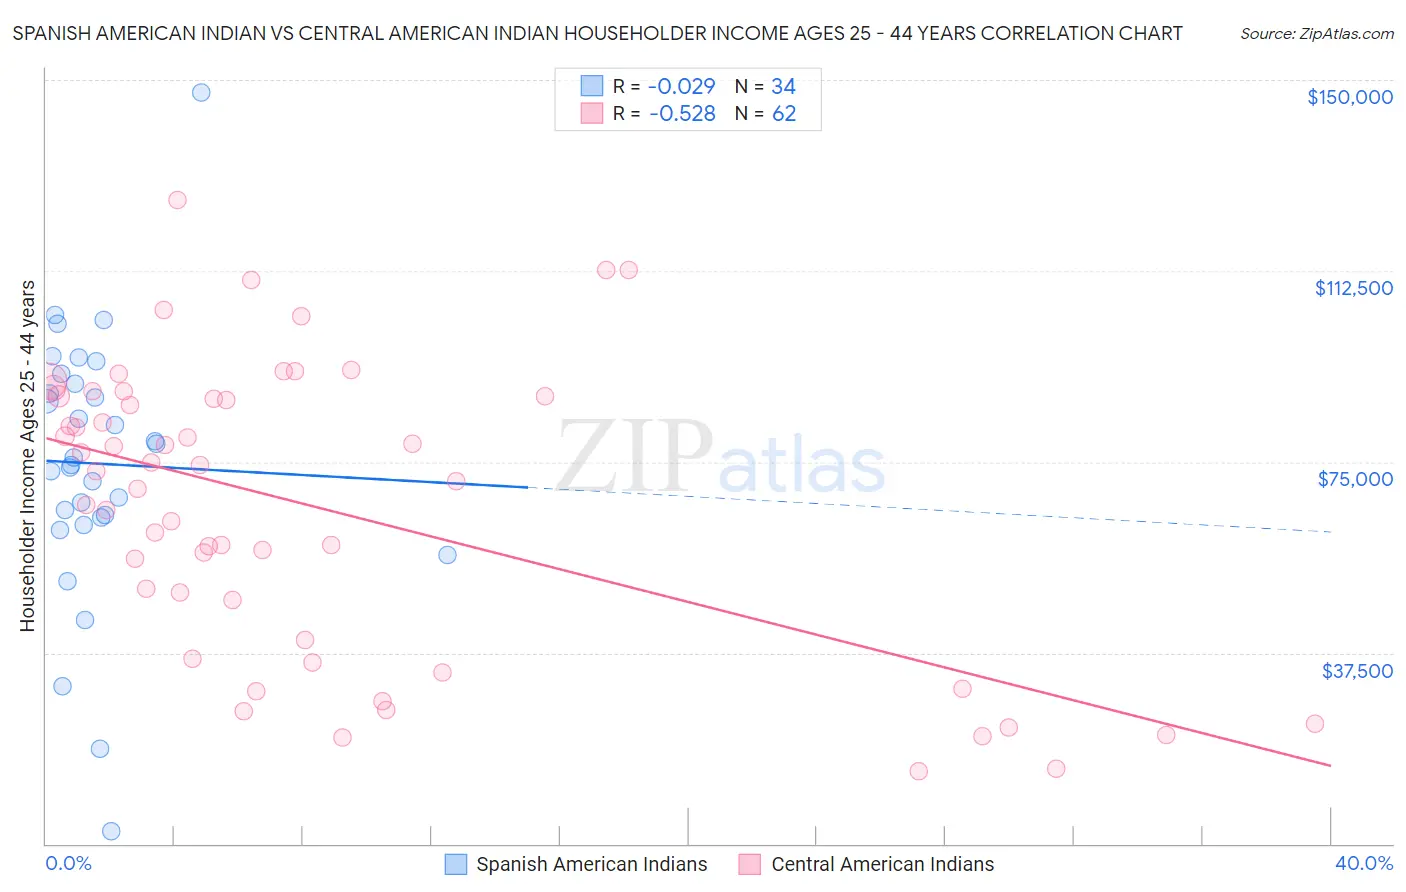
Spanish American Indian vs Central American Indian Householder Income Ages 25 - 44 years Correlation Chart
The statistical analysis conducted on geographies consisting of 73,137,186 people shows no correlation between the proportion of Spanish American Indians and household income with householder between the ages 25 and 44 in the United States with a correlation coefficient (R) of -0.029 and weighted average of $84,085. Similarly, the statistical analysis conducted on geographies consisting of 325,704,457 people shows a substantial negative correlation between the proportion of Central American Indians and household income with householder between the ages 25 and 44 in the United States with a correlation coefficient (R) of -0.528 and weighted average of $82,355, a difference of 2.1%.
Householder Income Ages 25 - 44 years Correlation Summary
| Measurement | Spanish American Indian | Central American Indian |
| Minimum | $2,499 | $14,158 |
| Maximum | $147,500 | $126,501 |
| Range | $145,001 | $112,343 |
| Mean | $74,648 | $66,041 |
| Median | $75,146 | $72,238 |
| Interquartile 25% (IQ1) | $64,148 | $39,906 |
| Interquartile 75% (IQ3) | $90,277 | $87,781 |
| Interquartile Range (IQR) | $26,129 | $47,875 |
| Standard Deviation (Sample) | $26,399 | $28,438 |
| Standard Deviation (Population) | $26,008 | $28,208 |
Demographics Similar to Spanish American Indians and Central American Indians by Householder Income Ages 25 - 44 years
In terms of householder income ages 25 - 44 years, the demographic groups most similar to Spanish American Indians are Subsaharan African ($84,235, a difference of 0.18%), Jamaican ($83,933, a difference of 0.18%), Hmong ($84,258, a difference of 0.21%), Immigrants from Cabo Verde ($84,304, a difference of 0.26%), and Sudanese ($84,401, a difference of 0.38%). Similarly, the demographic groups most similar to Central American Indians are Guatemalan ($82,331, a difference of 0.030%), Cajun ($82,393, a difference of 0.050%), Immigrants from Middle Africa ($82,254, a difference of 0.12%), Immigrants from Somalia ($82,188, a difference of 0.20%), and Colville ($82,604, a difference of 0.30%).
| Demographics | Rating | Rank | Householder Income Ages 25 - 44 years |
| Sudanese | 0.4 /100 | #265 | Tragic $84,401 |
| Immigrants | Cabo Verde | 0.3 /100 | #266 | Tragic $84,304 |
| Hmong | 0.3 /100 | #267 | Tragic $84,258 |
| Sub-Saharan Africans | 0.3 /100 | #268 | Tragic $84,235 |
| Spanish American Indians | 0.3 /100 | #269 | Tragic $84,085 |
| Jamaicans | 0.3 /100 | #270 | Tragic $83,933 |
| Somalis | 0.2 /100 | #271 | Tragic $83,752 |
| Spanish Americans | 0.2 /100 | #272 | Tragic $83,722 |
| Iroquois | 0.2 /100 | #273 | Tragic $83,682 |
| Marshallese | 0.2 /100 | #274 | Tragic $83,575 |
| Immigrants | Jamaica | 0.2 /100 | #275 | Tragic $83,298 |
| Immigrants | Belize | 0.2 /100 | #276 | Tragic $83,141 |
| Paiute | 0.2 /100 | #277 | Tragic $82,984 |
| Senegalese | 0.2 /100 | #278 | Tragic $82,852 |
| Pima | 0.1 /100 | #279 | Tragic $82,821 |
| Colville | 0.1 /100 | #280 | Tragic $82,604 |
| Cajuns | 0.1 /100 | #281 | Tragic $82,393 |
| Central American Indians | 0.1 /100 | #282 | Tragic $82,355 |
| Guatemalans | 0.1 /100 | #283 | Tragic $82,331 |
| Immigrants | Middle Africa | 0.1 /100 | #284 | Tragic $82,254 |
| Immigrants | Somalia | 0.1 /100 | #285 | Tragic $82,188 |