Soviet Union vs Tongan Median Female Earnings
COMPARE
Soviet Union
Tongan
Median Female Earnings
Median Female Earnings Comparison
Soviet Union
Tongans
$46,556
MEDIAN FEMALE EARNINGS
100.0/ 100
METRIC RATING
14th/ 347
METRIC RANK
$38,288
MEDIAN FEMALE EARNINGS
5.1/ 100
METRIC RATING
233rd/ 347
METRIC RANK
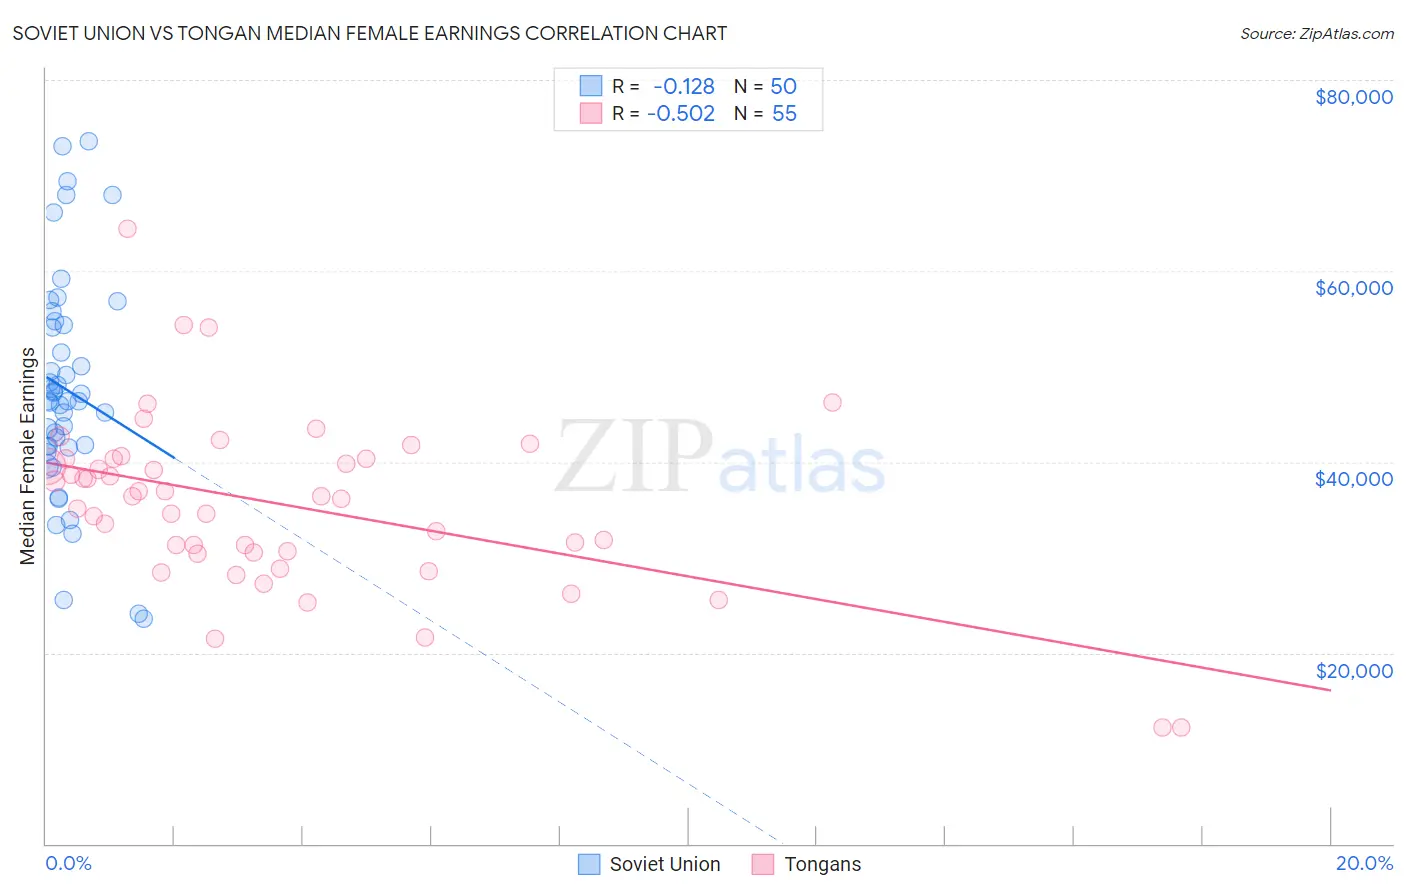
Soviet Union vs Tongan Median Female Earnings Correlation Chart
The statistical analysis conducted on geographies consisting of 43,506,452 people shows a poor negative correlation between the proportion of Soviet Union and median female earnings in the United States with a correlation coefficient (R) of -0.128 and weighted average of $46,556. Similarly, the statistical analysis conducted on geographies consisting of 102,899,109 people shows a substantial negative correlation between the proportion of Tongans and median female earnings in the United States with a correlation coefficient (R) of -0.502 and weighted average of $38,288, a difference of 21.6%.
Median Female Earnings Correlation Summary
| Measurement | Soviet Union | Tongan |
| Minimum | $23,611 | $12,128 |
| Maximum | $73,520 | $64,435 |
| Range | $49,909 | $52,307 |
| Mean | $47,577 | $35,533 |
| Median | $46,321 | $36,346 |
| Interquartile 25% (IQ1) | $41,646 | $30,514 |
| Interquartile 75% (IQ3) | $54,381 | $40,343 |
| Interquartile Range (IQR) | $12,735 | $9,829 |
| Standard Deviation (Sample) | $11,528 | $9,124 |
| Standard Deviation (Population) | $11,412 | $9,040 |
Similar Demographics by Median Female Earnings
Demographics Similar to Soviet Union by Median Female Earnings
In terms of median female earnings, the demographic groups most similar to Soviet Union are Immigrants from Australia ($46,573, a difference of 0.040%), Immigrants from Eastern Asia ($46,502, a difference of 0.11%), Indian (Asian) ($46,481, a difference of 0.16%), Immigrants from South Central Asia ($46,324, a difference of 0.50%), and Immigrants from Israel ($46,902, a difference of 0.74%).
| Demographics | Rating | Rank | Median Female Earnings |
| Thais | 100.0 /100 | #7 | Exceptional $47,577 |
| Iranians | 100.0 /100 | #8 | Exceptional $47,421 |
| Immigrants | Iran | 100.0 /100 | #9 | Exceptional $47,154 |
| Immigrants | China | 100.0 /100 | #10 | Exceptional $46,972 |
| Okinawans | 100.0 /100 | #11 | Exceptional $46,905 |
| Immigrants | Israel | 100.0 /100 | #12 | Exceptional $46,902 |
| Immigrants | Australia | 100.0 /100 | #13 | Exceptional $46,573 |
| Soviet Union | 100.0 /100 | #14 | Exceptional $46,556 |
| Immigrants | Eastern Asia | 100.0 /100 | #15 | Exceptional $46,502 |
| Indians (Asian) | 100.0 /100 | #16 | Exceptional $46,481 |
| Immigrants | South Central Asia | 100.0 /100 | #17 | Exceptional $46,324 |
| Cypriots | 100.0 /100 | #18 | Exceptional $45,570 |
| Eastern Europeans | 100.0 /100 | #19 | Exceptional $45,385 |
| Immigrants | Japan | 100.0 /100 | #20 | Exceptional $45,323 |
| Cambodians | 100.0 /100 | #21 | Exceptional $45,014 |
Demographics Similar to Tongans by Median Female Earnings
In terms of median female earnings, the demographic groups most similar to Tongans are Celtic ($38,283, a difference of 0.010%), Scandinavian ($38,306, a difference of 0.050%), Somali ($38,333, a difference of 0.12%), Basque ($38,352, a difference of 0.17%), and Sudanese ($38,215, a difference of 0.19%).
| Demographics | Rating | Rank | Median Female Earnings |
| French Canadians | 6.8 /100 | #226 | Tragic $38,436 |
| Scottish | 6.3 /100 | #227 | Tragic $38,397 |
| Sub-Saharan Africans | 6.2 /100 | #228 | Tragic $38,391 |
| Belgians | 6.1 /100 | #229 | Tragic $38,382 |
| Basques | 5.7 /100 | #230 | Tragic $38,352 |
| Somalis | 5.5 /100 | #231 | Tragic $38,333 |
| Scandinavians | 5.2 /100 | #232 | Tragic $38,306 |
| Tongans | 5.1 /100 | #233 | Tragic $38,288 |
| Celtics | 5.0 /100 | #234 | Tragic $38,283 |
| Sudanese | 4.4 /100 | #235 | Tragic $38,215 |
| Liberians | 4.4 /100 | #236 | Tragic $38,215 |
| Immigrants | Cabo Verde | 4.3 /100 | #237 | Tragic $38,208 |
| Alaska Natives | 4.3 /100 | #238 | Tragic $38,202 |
| English | 4.2 /100 | #239 | Tragic $38,196 |
| Finns | 4.0 /100 | #240 | Tragic $38,173 |