South American vs Zimbabwean Median Male Earnings
COMPARE
South American
Zimbabwean
Median Male Earnings
Median Male Earnings Comparison
South Americans
Zimbabweans
$54,492
MEDIAN MALE EARNINGS
50.0/ 100
METRIC RATING
174th/ 347
METRIC RANK
$56,302
MEDIAN MALE EARNINGS
85.5/ 100
METRIC RATING
139th/ 347
METRIC RANK
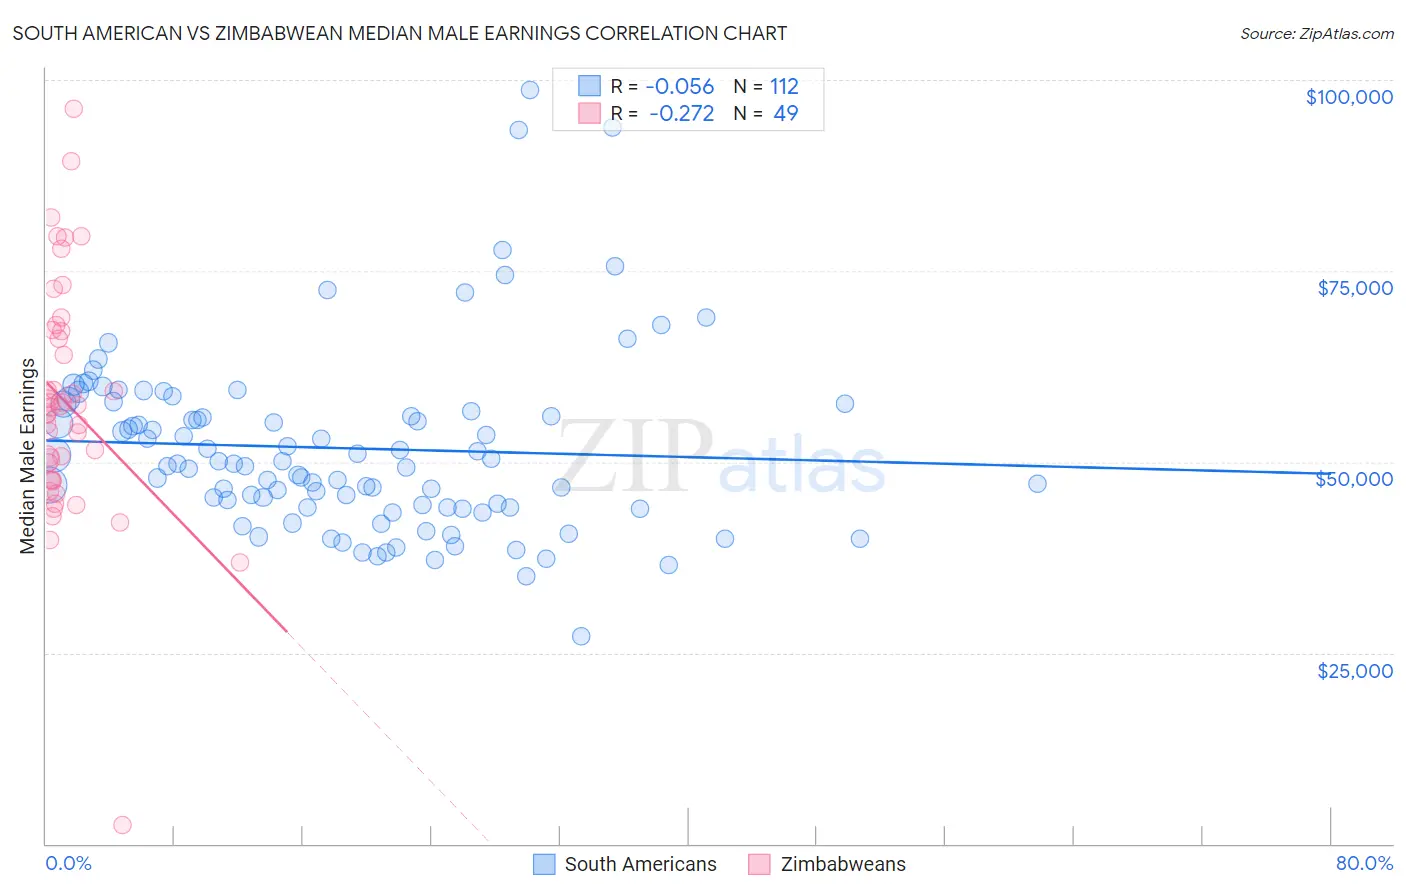
South American vs Zimbabwean Median Male Earnings Correlation Chart
The statistical analysis conducted on geographies consisting of 493,870,370 people shows a slight negative correlation between the proportion of South Americans and median male earnings in the United States with a correlation coefficient (R) of -0.056 and weighted average of $54,492. Similarly, the statistical analysis conducted on geographies consisting of 69,206,147 people shows a weak negative correlation between the proportion of Zimbabweans and median male earnings in the United States with a correlation coefficient (R) of -0.272 and weighted average of $56,302, a difference of 3.3%.
Median Male Earnings Correlation Summary
| Measurement | South American | Zimbabwean |
| Minimum | $27,125 | $2,499 |
| Maximum | $98,656 | $96,250 |
| Range | $71,531 | $93,751 |
| Mean | $51,788 | $57,721 |
| Median | $49,715 | $57,093 |
| Interquartile 25% (IQ1) | $44,028 | $47,581 |
| Interquartile 75% (IQ3) | $57,077 | $67,190 |
| Interquartile Range (IQR) | $13,050 | $19,609 |
| Standard Deviation (Sample) | $11,850 | $15,546 |
| Standard Deviation (Population) | $11,797 | $15,387 |
Similar Demographics by Median Male Earnings
Demographics Similar to South Americans by Median Male Earnings
In terms of median male earnings, the demographic groups most similar to South Americans are South American Indian ($54,508, a difference of 0.030%), Dutch ($54,410, a difference of 0.15%), Spaniard ($54,401, a difference of 0.17%), Welsh ($54,647, a difference of 0.28%), and Immigrants from Peru ($54,695, a difference of 0.37%).
| Demographics | Rating | Rank | Median Male Earnings |
| Immigrants | Fiji | 61.2 /100 | #167 | Good $54,958 |
| Immigrants | Vietnam | 60.2 /100 | #168 | Good $54,913 |
| French Canadians | 55.6 /100 | #169 | Average $54,722 |
| Finns | 55.6 /100 | #170 | Average $54,721 |
| Immigrants | Peru | 54.9 /100 | #171 | Average $54,695 |
| Welsh | 53.8 /100 | #172 | Average $54,647 |
| South American Indians | 50.4 /100 | #173 | Average $54,508 |
| South Americans | 50.0 /100 | #174 | Average $54,492 |
| Dutch | 48.0 /100 | #175 | Average $54,410 |
| Spaniards | 47.8 /100 | #176 | Average $54,401 |
| Costa Ricans | 44.8 /100 | #177 | Average $54,279 |
| Sierra Leoneans | 44.8 /100 | #178 | Average $54,279 |
| Celtics | 43.9 /100 | #179 | Average $54,242 |
| Iraqis | 42.5 /100 | #180 | Average $54,182 |
| Immigrants | Immigrants | 42.1 /100 | #181 | Average $54,168 |
Demographics Similar to Zimbabweans by Median Male Earnings
In terms of median male earnings, the demographic groups most similar to Zimbabweans are Luxembourger ($56,300, a difference of 0.0%), Slovak ($56,306, a difference of 0.010%), Danish ($56,246, a difference of 0.10%), Ethiopian ($56,243, a difference of 0.10%), and Slavic ($56,390, a difference of 0.16%).
| Demographics | Rating | Rank | Median Male Earnings |
| Czechs | 88.2 /100 | #132 | Excellent $56,546 |
| Immigrants | Germany | 88.2 /100 | #133 | Excellent $56,542 |
| Moroccans | 87.7 /100 | #134 | Excellent $56,499 |
| Irish | 87.4 /100 | #135 | Excellent $56,464 |
| Immigrants | Saudi Arabia | 87.2 /100 | #136 | Excellent $56,452 |
| Slavs | 86.5 /100 | #137 | Excellent $56,390 |
| Slovaks | 85.5 /100 | #138 | Excellent $56,306 |
| Zimbabweans | 85.5 /100 | #139 | Excellent $56,302 |
| Luxembourgers | 85.5 /100 | #140 | Excellent $56,300 |
| Danes | 84.8 /100 | #141 | Excellent $56,246 |
| Ethiopians | 84.8 /100 | #142 | Excellent $56,243 |
| Sri Lankans | 83.4 /100 | #143 | Excellent $56,136 |
| Immigrants | Uganda | 82.4 /100 | #144 | Excellent $56,064 |
| Norwegians | 80.9 /100 | #145 | Excellent $55,965 |
| Immigrants | Chile | 80.7 /100 | #146 | Excellent $55,954 |