South American vs Immigrants from Mexico Householder Income Ages 25 - 44 years
COMPARE
South American
Immigrants from Mexico
Householder Income Ages 25 - 44 years
Householder Income Ages 25 - 44 years Comparison
South Americans
Immigrants from Mexico
$95,362
HOUSEHOLDER INCOME AGES 25 - 44 YEARS
60.9/ 100
METRIC RATING
164th/ 347
METRIC RANK
$78,809
HOUSEHOLDER INCOME AGES 25 - 44 YEARS
0.0/ 100
METRIC RATING
318th/ 347
METRIC RANK
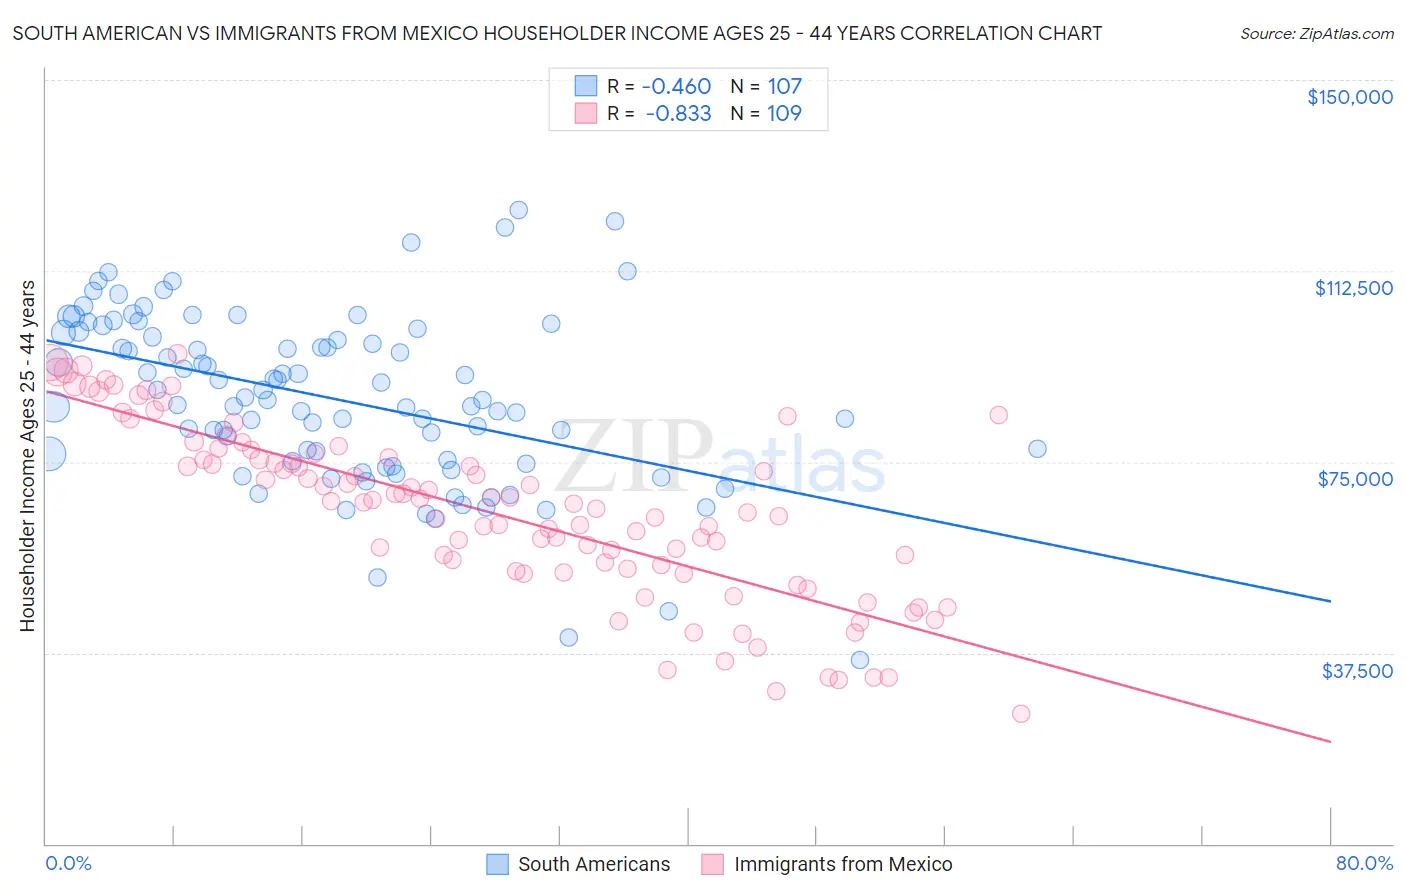
South American vs Immigrants from Mexico Householder Income Ages 25 - 44 years Correlation Chart
The statistical analysis conducted on geographies consisting of 492,106,064 people shows a moderate negative correlation between the proportion of South Americans and household income with householder between the ages 25 and 44 in the United States with a correlation coefficient (R) of -0.460 and weighted average of $95,362. Similarly, the statistical analysis conducted on geographies consisting of 510,586,481 people shows a very strong negative correlation between the proportion of Immigrants from Mexico and household income with householder between the ages 25 and 44 in the United States with a correlation coefficient (R) of -0.833 and weighted average of $78,809, a difference of 21.0%.
Householder Income Ages 25 - 44 years Correlation Summary
| Measurement | South American | Immigrants from Mexico |
| Minimum | $36,176 | $25,500 |
| Maximum | $124,375 | $96,265 |
| Range | $88,199 | $70,765 |
| Mean | $87,458 | $65,144 |
| Median | $87,265 | $66,989 |
| Interquartile 25% (IQ1) | $75,189 | $53,834 |
| Interquartile 75% (IQ3) | $100,291 | $76,158 |
| Interquartile Range (IQR) | $25,102 | $22,324 |
| Standard Deviation (Sample) | $16,777 | $16,884 |
| Standard Deviation (Population) | $16,698 | $16,806 |
Similar Demographics by Householder Income Ages 25 - 44 years
Demographics Similar to South Americans by Householder Income Ages 25 - 44 years
In terms of householder income ages 25 - 44 years, the demographic groups most similar to South Americans are Immigrants from Nepal ($95,322, a difference of 0.040%), Immigrants from Saudi Arabia ($95,450, a difference of 0.090%), Immigrants from Ethiopia ($95,256, a difference of 0.11%), Immigrants from Portugal ($95,512, a difference of 0.16%), and Swiss ($95,511, a difference of 0.16%).
| Demographics | Rating | Rank | Householder Income Ages 25 - 44 years |
| Immigrants | Uganda | 65.2 /100 | #157 | Good $95,698 |
| Scandinavians | 63.9 /100 | #158 | Good $95,596 |
| Costa Ricans | 63.5 /100 | #159 | Good $95,565 |
| Icelanders | 63.4 /100 | #160 | Good $95,560 |
| Immigrants | Portugal | 62.8 /100 | #161 | Good $95,512 |
| Swiss | 62.8 /100 | #162 | Good $95,511 |
| Immigrants | Saudi Arabia | 62.0 /100 | #163 | Good $95,450 |
| South Americans | 60.9 /100 | #164 | Good $95,362 |
| Immigrants | Nepal | 60.3 /100 | #165 | Good $95,322 |
| Immigrants | Ethiopia | 59.5 /100 | #166 | Average $95,256 |
| Czechoslovakians | 57.0 /100 | #167 | Average $95,070 |
| Alsatians | 56.8 /100 | #168 | Average $95,059 |
| Native Hawaiians | 56.8 /100 | #169 | Average $95,058 |
| Slovaks | 56.4 /100 | #170 | Average $95,032 |
| Immigrants | Armenia | 54.2 /100 | #171 | Average $94,867 |
Demographics Similar to Immigrants from Mexico by Householder Income Ages 25 - 44 years
In terms of householder income ages 25 - 44 years, the demographic groups most similar to Immigrants from Mexico are U.S. Virgin Islander ($78,911, a difference of 0.13%), African ($78,986, a difference of 0.22%), Ottawa ($79,012, a difference of 0.26%), Honduran ($78,540, a difference of 0.34%), and Cheyenne ($79,152, a difference of 0.44%).
| Demographics | Rating | Rank | Householder Income Ages 25 - 44 years |
| Indonesians | 0.0 /100 | #311 | Tragic $79,543 |
| Immigrants | Haiti | 0.0 /100 | #312 | Tragic $79,391 |
| Menominee | 0.0 /100 | #313 | Tragic $79,358 |
| Cheyenne | 0.0 /100 | #314 | Tragic $79,152 |
| Ottawa | 0.0 /100 | #315 | Tragic $79,012 |
| Africans | 0.0 /100 | #316 | Tragic $78,986 |
| U.S. Virgin Islanders | 0.0 /100 | #317 | Tragic $78,911 |
| Immigrants | Mexico | 0.0 /100 | #318 | Tragic $78,809 |
| Hondurans | 0.0 /100 | #319 | Tragic $78,540 |
| Choctaw | 0.0 /100 | #320 | Tragic $78,168 |
| Immigrants | Zaire | 0.0 /100 | #321 | Tragic $78,045 |
| Chickasaw | 0.0 /100 | #322 | Tragic $77,929 |
| Immigrants | Honduras | 0.0 /100 | #323 | Tragic $77,328 |
| Dutch West Indians | 0.0 /100 | #324 | Tragic $77,260 |
| Sioux | 0.0 /100 | #325 | Tragic $77,089 |