South American Indian vs Immigrants from Sierra Leone Householder Income Ages 45 - 64 years
COMPARE
South American Indian
Immigrants from Sierra Leone
Householder Income Ages 45 - 64 years
Householder Income Ages 45 - 64 years Comparison
South American Indians
Immigrants from Sierra Leone
$101,171
HOUSEHOLDER INCOME AGES 45 - 64 YEARS
60.5/ 100
METRIC RATING
168th/ 347
METRIC RANK
$103,227
HOUSEHOLDER INCOME AGES 45 - 64 YEARS
81.1/ 100
METRIC RATING
149th/ 347
METRIC RANK
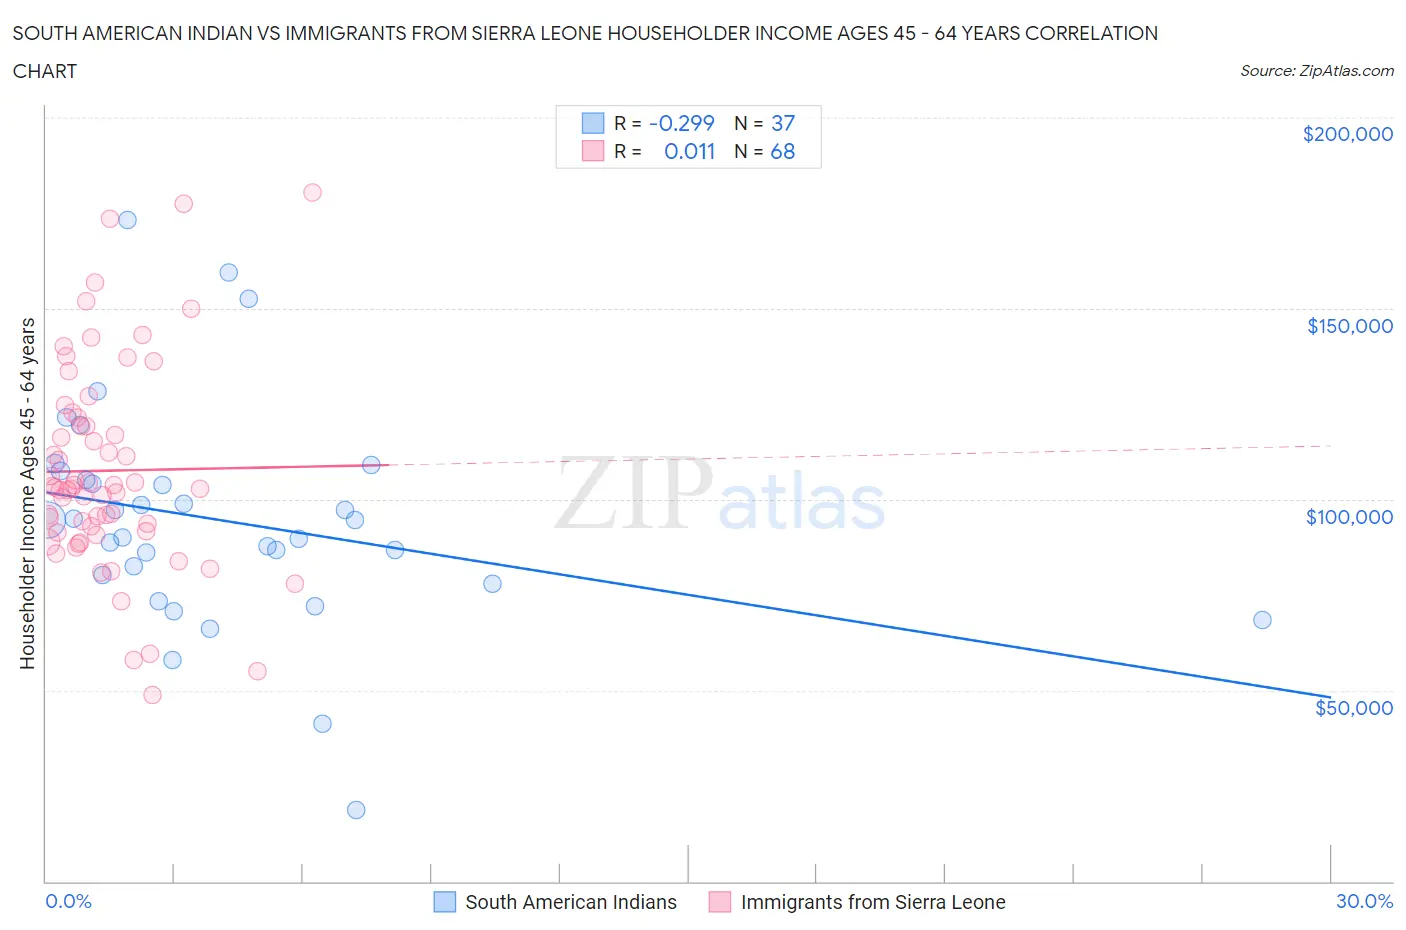
South American Indian vs Immigrants from Sierra Leone Householder Income Ages 45 - 64 years Correlation Chart
The statistical analysis conducted on geographies consisting of 164,498,576 people shows a weak negative correlation between the proportion of South American Indians and household income with householder between the ages 45 and 64 in the United States with a correlation coefficient (R) of -0.299 and weighted average of $101,171. Similarly, the statistical analysis conducted on geographies consisting of 101,631,094 people shows no correlation between the proportion of Immigrants from Sierra Leone and household income with householder between the ages 45 and 64 in the United States with a correlation coefficient (R) of 0.011 and weighted average of $103,227, a difference of 2.0%.
Householder Income Ages 45 - 64 years Correlation Summary
| Measurement | South American Indian | Immigrants from Sierra Leone |
| Minimum | $18,682 | $48,831 |
| Maximum | $173,033 | $180,469 |
| Range | $154,351 | $131,638 |
| Mean | $94,461 | $107,504 |
| Median | $94,583 | $102,977 |
| Interquartile 25% (IQ1) | $79,132 | $91,548 |
| Interquartile 75% (IQ3) | $106,330 | $120,393 |
| Interquartile Range (IQR) | $27,199 | $28,845 |
| Standard Deviation (Sample) | $29,348 | $27,099 |
| Standard Deviation (Population) | $28,948 | $26,899 |
Demographics Similar to South American Indians and Immigrants from Sierra Leone by Householder Income Ages 45 - 64 years
In terms of householder income ages 45 - 64 years, the demographic groups most similar to South American Indians are Czechoslovakian ($101,387, a difference of 0.21%), Samoan ($101,580, a difference of 0.40%), Immigrants from Albania ($101,957, a difference of 0.78%), Immigrants from Morocco ($102,015, a difference of 0.83%), and English ($102,021, a difference of 0.84%). Similarly, the demographic groups most similar to Immigrants from Sierra Leone are Immigrants from Germany ($103,282, a difference of 0.050%), Immigrants from Peru ($103,173, a difference of 0.050%), Swiss ($103,071, a difference of 0.15%), Irish ($103,067, a difference of 0.16%), and Scandinavian ($102,969, a difference of 0.25%).
| Demographics | Rating | Rank | Householder Income Ages 45 - 64 years |
| Immigrants | Germany | 81.5 /100 | #148 | Excellent $103,282 |
| Immigrants | Sierra Leone | 81.1 /100 | #149 | Excellent $103,227 |
| Immigrants | Peru | 80.7 /100 | #150 | Excellent $103,173 |
| Swiss | 79.9 /100 | #151 | Good $103,071 |
| Irish | 79.8 /100 | #152 | Good $103,067 |
| Scandinavians | 79.0 /100 | #153 | Good $102,969 |
| Slovenes | 78.3 /100 | #154 | Good $102,885 |
| Costa Ricans | 77.4 /100 | #155 | Good $102,779 |
| Carpatho Rusyns | 77.4 /100 | #156 | Good $102,777 |
| Immigrants | Ethiopia | 77.3 /100 | #157 | Good $102,763 |
| Slavs | 76.1 /100 | #158 | Good $102,629 |
| Sierra Leoneans | 74.2 /100 | #159 | Good $102,427 |
| Icelanders | 72.5 /100 | #160 | Good $102,261 |
| Immigrants | Nepal | 71.8 /100 | #161 | Good $102,190 |
| Scottish | 71.1 /100 | #162 | Good $102,123 |
| English | 70.1 /100 | #163 | Good $102,021 |
| Immigrants | Morocco | 70.0 /100 | #164 | Good $102,015 |
| Immigrants | Albania | 69.4 /100 | #165 | Good $101,957 |
| Samoans | 65.3 /100 | #166 | Good $101,580 |
| Czechoslovakians | 63.0 /100 | #167 | Good $101,387 |
| South American Indians | 60.5 /100 | #168 | Good $101,171 |