South African vs Immigrants from South Africa Per Capita Income
COMPARE
South African
Immigrants from South Africa
Per Capita Income
Per Capita Income Comparison
South Africans
Immigrants from South Africa
$50,044
PER CAPITA INCOME
99.9/ 100
METRIC RATING
57th/ 347
METRIC RANK
$51,465
PER CAPITA INCOME
100.0/ 100
METRIC RATING
41st/ 347
METRIC RANK
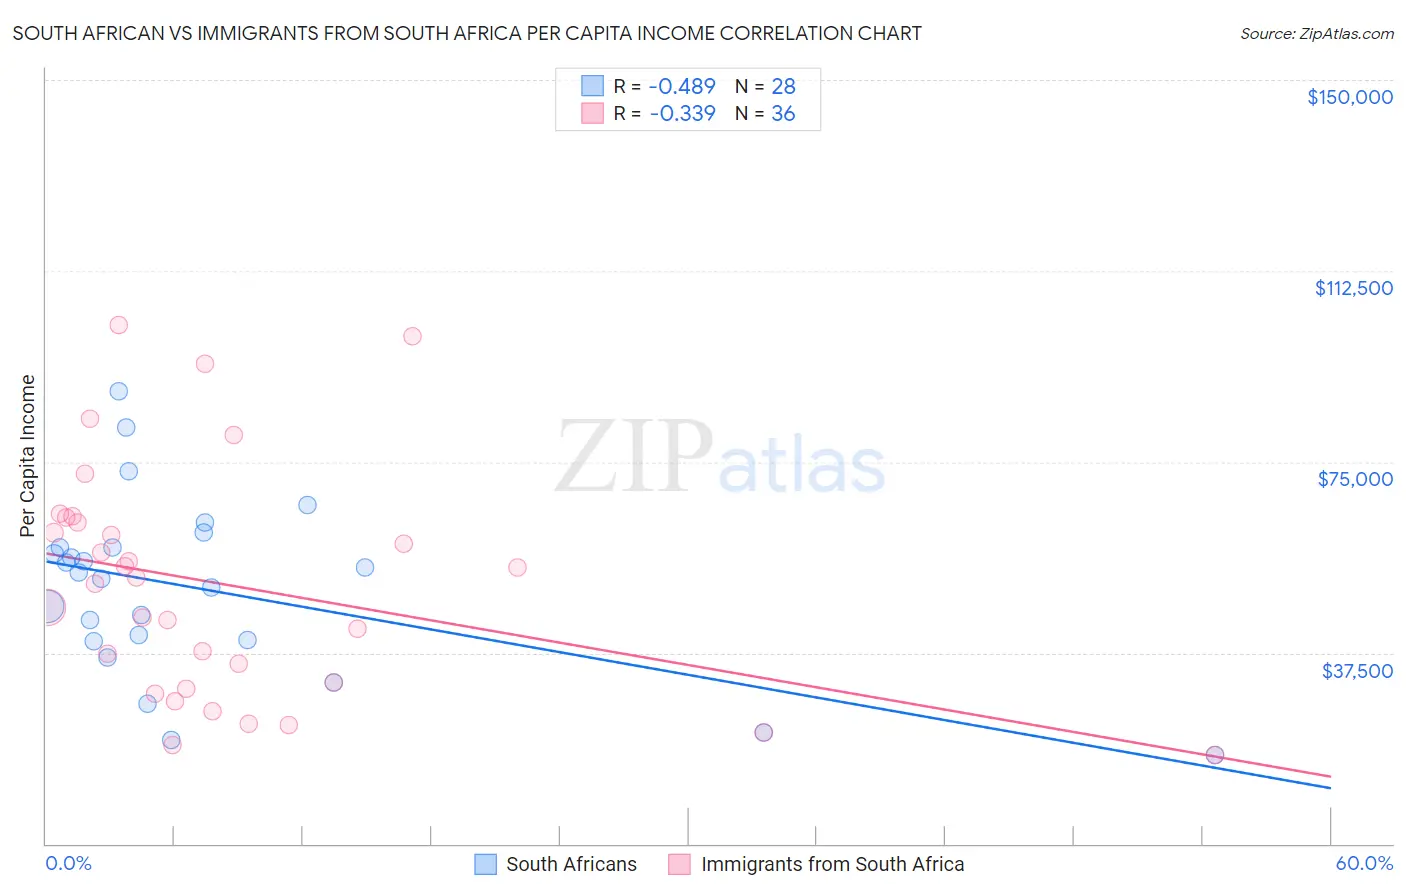
South African vs Immigrants from South Africa Per Capita Income Correlation Chart
The statistical analysis conducted on geographies consisting of 182,604,546 people shows a moderate negative correlation between the proportion of South Africans and per capita income in the United States with a correlation coefficient (R) of -0.489 and weighted average of $50,044. Similarly, the statistical analysis conducted on geographies consisting of 233,322,165 people shows a mild negative correlation between the proportion of Immigrants from South Africa and per capita income in the United States with a correlation coefficient (R) of -0.339 and weighted average of $51,465, a difference of 2.8%.
Per Capita Income Correlation Summary
| Measurement | South African | Immigrants from South Africa |
| Minimum | $17,364 | $17,364 |
| Maximum | $88,818 | $101,840 |
| Range | $71,454 | $84,476 |
| Mean | $49,855 | $50,905 |
| Median | $52,728 | $51,695 |
| Interquartile 25% (IQ1) | $39,824 | $31,167 |
| Interquartile 75% (IQ3) | $58,137 | $63,482 |
| Interquartile Range (IQR) | $18,313 | $32,314 |
| Standard Deviation (Sample) | $17,281 | $22,644 |
| Standard Deviation (Population) | $16,970 | $22,328 |
Demographics Similar to South Africans and Immigrants from South Africa by Per Capita Income
In terms of per capita income, the demographic groups most similar to South Africans are Asian ($50,057, a difference of 0.030%), Immigrants from Western Europe ($50,065, a difference of 0.040%), Immigrants from Malaysia ($49,983, a difference of 0.12%), Bhutanese ($49,894, a difference of 0.30%), and Immigrants from Belarus ($50,303, a difference of 0.52%). Similarly, the demographic groups most similar to Immigrants from South Africa are Immigrants from Turkey ($51,368, a difference of 0.19%), Immigrants from Lithuania ($51,361, a difference of 0.20%), Immigrants from Korea ($51,671, a difference of 0.40%), Cambodian ($51,731, a difference of 0.52%), and Immigrants from Europe ($50,950, a difference of 1.0%).
| Demographics | Rating | Rank | Per Capita Income |
| Cambodians | 100.0 /100 | #39 | Exceptional $51,731 |
| Immigrants | Korea | 100.0 /100 | #40 | Exceptional $51,671 |
| Immigrants | South Africa | 100.0 /100 | #41 | Exceptional $51,465 |
| Immigrants | Turkey | 100.0 /100 | #42 | Exceptional $51,368 |
| Immigrants | Lithuania | 100.0 /100 | #43 | Exceptional $51,361 |
| Immigrants | Europe | 100.0 /100 | #44 | Exceptional $50,950 |
| Immigrants | Spain | 100.0 /100 | #45 | Exceptional $50,933 |
| Immigrants | Latvia | 100.0 /100 | #46 | Exceptional $50,914 |
| Bulgarians | 100.0 /100 | #47 | Exceptional $50,906 |
| Immigrants | Serbia | 100.0 /100 | #48 | Exceptional $50,810 |
| New Zealanders | 100.0 /100 | #49 | Exceptional $50,575 |
| Immigrants | Sri Lanka | 100.0 /100 | #50 | Exceptional $50,555 |
| Immigrants | Netherlands | 100.0 /100 | #51 | Exceptional $50,458 |
| Immigrants | Croatia | 99.9 /100 | #52 | Exceptional $50,417 |
| Paraguayans | 99.9 /100 | #53 | Exceptional $50,385 |
| Immigrants | Belarus | 99.9 /100 | #54 | Exceptional $50,303 |
| Immigrants | Western Europe | 99.9 /100 | #55 | Exceptional $50,065 |
| Asians | 99.9 /100 | #56 | Exceptional $50,057 |
| South Africans | 99.9 /100 | #57 | Exceptional $50,044 |
| Immigrants | Malaysia | 99.9 /100 | #58 | Exceptional $49,983 |
| Bhutanese | 99.9 /100 | #59 | Exceptional $49,894 |