Slovene vs Tsimshian Householder Income Ages 25 - 44 years
COMPARE
Slovene
Tsimshian
Householder Income Ages 25 - 44 years
Householder Income Ages 25 - 44 years Comparison
Slovenes
Tsimshian
$96,439
HOUSEHOLDER INCOME AGES 25 - 44 YEARS
73.9/ 100
METRIC RATING
153rd/ 347
METRIC RANK
$97,809
HOUSEHOLDER INCOME AGES 25 - 44 YEARS
85.8/ 100
METRIC RATING
133rd/ 347
METRIC RANK
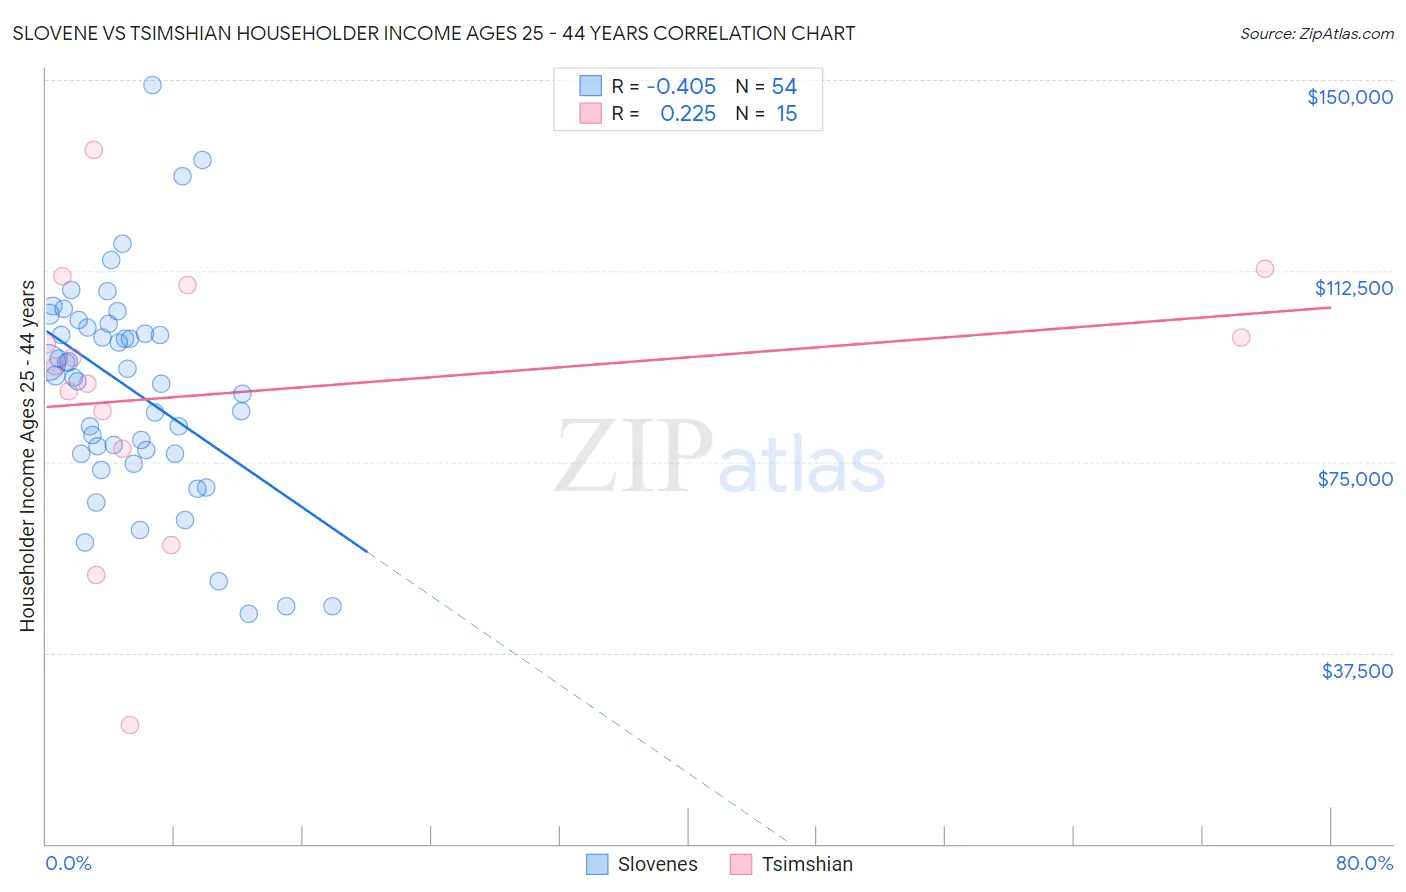
Slovene vs Tsimshian Householder Income Ages 25 - 44 years Correlation Chart
The statistical analysis conducted on geographies consisting of 260,772,940 people shows a moderate negative correlation between the proportion of Slovenes and household income with householder between the ages 25 and 44 in the United States with a correlation coefficient (R) of -0.405 and weighted average of $96,439. Similarly, the statistical analysis conducted on geographies consisting of 15,621,525 people shows a weak positive correlation between the proportion of Tsimshian and household income with householder between the ages 25 and 44 in the United States with a correlation coefficient (R) of 0.225 and weighted average of $97,809, a difference of 1.4%.
Householder Income Ages 25 - 44 years Correlation Summary
| Measurement | Slovene | Tsimshian |
| Minimum | $45,114 | $23,438 |
| Maximum | $149,005 | $136,250 |
| Range | $103,891 | $112,812 |
| Mean | $89,263 | $88,925 |
| Median | $91,712 | $93,749 |
| Interquartile 25% (IQ1) | $76,661 | $77,546 |
| Interquartile 75% (IQ3) | $101,430 | $109,750 |
| Interquartile Range (IQR) | $24,769 | $32,204 |
| Standard Deviation (Sample) | $21,285 | $27,608 |
| Standard Deviation (Population) | $21,087 | $26,672 |
Demographics Similar to Slovenes and Tsimshian by Householder Income Ages 25 - 44 years
In terms of householder income ages 25 - 44 years, the demographic groups most similar to Slovenes are South American Indian ($96,497, a difference of 0.060%), Czech ($96,525, a difference of 0.090%), Ugandan ($96,667, a difference of 0.24%), Basque ($96,709, a difference of 0.28%), and Irish ($96,730, a difference of 0.30%). Similarly, the demographic groups most similar to Tsimshian are Canadian ($97,625, a difference of 0.19%), Immigrants from Oceania ($97,623, a difference of 0.19%), Hungarian ($97,544, a difference of 0.27%), Lebanese ($97,339, a difference of 0.48%), and Arab ($97,336, a difference of 0.49%).
| Demographics | Rating | Rank | Householder Income Ages 25 - 44 years |
| Tsimshian | 85.8 /100 | #133 | Excellent $97,809 |
| Canadians | 84.5 /100 | #134 | Excellent $97,625 |
| Immigrants | Oceania | 84.5 /100 | #135 | Excellent $97,623 |
| Hungarians | 83.9 /100 | #136 | Excellent $97,544 |
| Lebanese | 82.3 /100 | #137 | Excellent $97,339 |
| Arabs | 82.3 /100 | #138 | Excellent $97,336 |
| Immigrants | Peru | 82.2 /100 | #139 | Excellent $97,329 |
| Immigrants | Morocco | 82.0 /100 | #140 | Excellent $97,305 |
| Luxembourgers | 81.5 /100 | #141 | Excellent $97,237 |
| Danes | 81.3 /100 | #142 | Excellent $97,221 |
| Immigrants | Jordan | 81.0 /100 | #143 | Excellent $97,185 |
| Immigrants | Chile | 80.8 /100 | #144 | Excellent $97,159 |
| Norwegians | 78.2 /100 | #145 | Good $96,866 |
| Ethiopians | 77.8 /100 | #146 | Good $96,824 |
| Immigrants | Syria | 77.4 /100 | #147 | Good $96,789 |
| Irish | 76.9 /100 | #148 | Good $96,730 |
| Basques | 76.6 /100 | #149 | Good $96,709 |
| Ugandans | 76.2 /100 | #150 | Good $96,667 |
| Czechs | 74.8 /100 | #151 | Good $96,525 |
| South American Indians | 74.5 /100 | #152 | Good $96,497 |
| Slovenes | 73.9 /100 | #153 | Good $96,439 |