Slavic vs Immigrants from Grenada Median Household Income
COMPARE
Slavic
Immigrants from Grenada
Median Household Income
Median Household Income Comparison
Slavs
Immigrants from Grenada
$86,398
MEDIAN HOUSEHOLD INCOME
69.7/ 100
METRIC RATING
161st/ 347
METRIC RANK
$76,517
MEDIAN HOUSEHOLD INCOME
0.4/ 100
METRIC RATING
261st/ 347
METRIC RANK
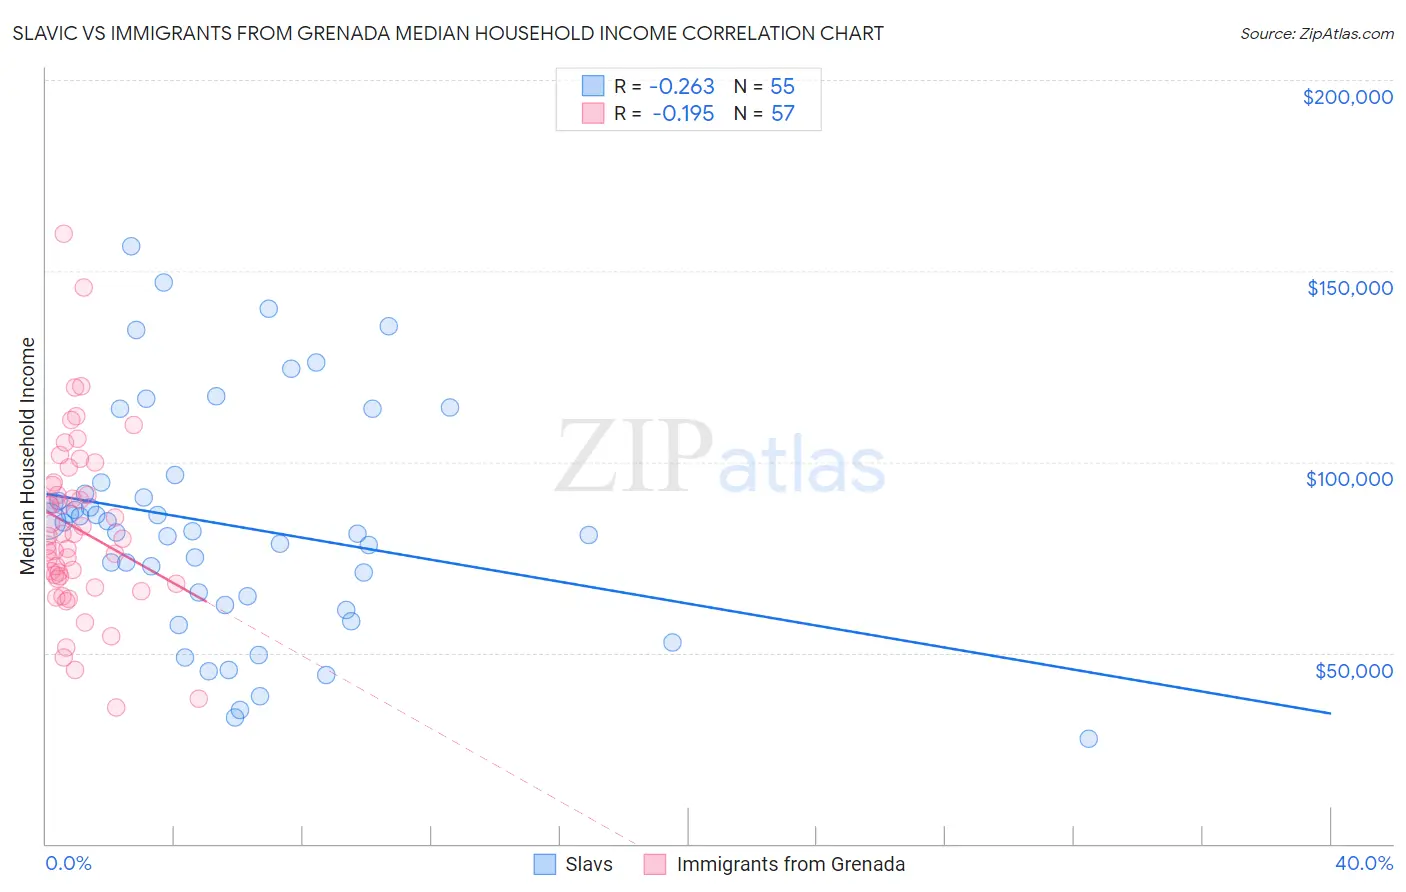
Slavic vs Immigrants from Grenada Median Household Income Correlation Chart
The statistical analysis conducted on geographies consisting of 270,777,755 people shows a weak negative correlation between the proportion of Slavs and median household income in the United States with a correlation coefficient (R) of -0.263 and weighted average of $86,398. Similarly, the statistical analysis conducted on geographies consisting of 67,183,202 people shows a poor negative correlation between the proportion of Immigrants from Grenada and median household income in the United States with a correlation coefficient (R) of -0.195 and weighted average of $76,517, a difference of 12.9%.
Median Household Income Correlation Summary
| Measurement | Slavic | Immigrants from Grenada |
| Minimum | $27,389 | $35,840 |
| Maximum | $156,479 | $159,688 |
| Range | $129,090 | $123,848 |
| Mean | $83,350 | $82,524 |
| Median | $81,875 | $79,885 |
| Interquartile 25% (IQ1) | $62,500 | $68,699 |
| Interquartile 75% (IQ3) | $94,752 | $94,214 |
| Interquartile Range (IQR) | $32,252 | $25,515 |
| Standard Deviation (Sample) | $29,906 | $23,320 |
| Standard Deviation (Population) | $29,633 | $23,115 |
Similar Demographics by Median Household Income
Demographics Similar to Slavs by Median Household Income
In terms of median household income, the demographic groups most similar to Slavs are Luxembourger ($86,418, a difference of 0.020%), Immigrants from Uzbekistan ($86,425, a difference of 0.030%), Moroccan ($86,468, a difference of 0.080%), Samoan ($86,498, a difference of 0.12%), and Immigrants from Albania ($86,534, a difference of 0.16%).
| Demographics | Rating | Rank | Median Household Income |
| Immigrants | Germany | 74.4 /100 | #154 | Good $86,764 |
| Carpatho Rusyns | 72.8 /100 | #155 | Good $86,635 |
| Immigrants | Albania | 71.5 /100 | #156 | Good $86,534 |
| Samoans | 71.0 /100 | #157 | Good $86,498 |
| Moroccans | 70.6 /100 | #158 | Good $86,468 |
| Immigrants | Uzbekistan | 70.1 /100 | #159 | Good $86,425 |
| Luxembourgers | 70.0 /100 | #160 | Good $86,418 |
| Slavs | 69.7 /100 | #161 | Good $86,398 |
| Guamanians/Chamorros | 67.7 /100 | #162 | Good $86,255 |
| Czechs | 66.4 /100 | #163 | Good $86,164 |
| Irish | 66.2 /100 | #164 | Good $86,145 |
| Norwegians | 65.3 /100 | #165 | Good $86,084 |
| Scandinavians | 65.1 /100 | #166 | Good $86,073 |
| Immigrants | Immigrants | 61.3 /100 | #167 | Good $85,818 |
| Icelanders | 61.0 /100 | #168 | Good $85,797 |
Demographics Similar to Immigrants from Grenada by Median Household Income
In terms of median household income, the demographic groups most similar to Immigrants from Grenada are Jamaican ($76,583, a difference of 0.090%), French American Indian ($76,387, a difference of 0.17%), Alaskan Athabascan ($76,383, a difference of 0.18%), Spanish American Indian ($76,670, a difference of 0.20%), and Immigrants from Nicaragua ($76,784, a difference of 0.35%).
| Demographics | Rating | Rank | Median Household Income |
| Sub-Saharan Africans | 0.8 /100 | #254 | Tragic $77,631 |
| Immigrants | Middle Africa | 0.8 /100 | #255 | Tragic $77,559 |
| Belizeans | 0.6 /100 | #256 | Tragic $77,028 |
| Immigrants | Senegal | 0.5 /100 | #257 | Tragic $76,915 |
| Immigrants | Nicaragua | 0.5 /100 | #258 | Tragic $76,784 |
| Spanish American Indians | 0.4 /100 | #259 | Tragic $76,670 |
| Jamaicans | 0.4 /100 | #260 | Tragic $76,583 |
| Immigrants | Grenada | 0.4 /100 | #261 | Tragic $76,517 |
| French American Indians | 0.4 /100 | #262 | Tragic $76,387 |
| Alaskan Athabascans | 0.4 /100 | #263 | Tragic $76,383 |
| Guatemalans | 0.3 /100 | #264 | Tragic $75,961 |
| Immigrants | Belize | 0.3 /100 | #265 | Tragic $75,938 |
| Americans | 0.3 /100 | #266 | Tragic $75,932 |
| German Russians | 0.3 /100 | #267 | Tragic $75,856 |
| Immigrants | Jamaica | 0.3 /100 | #268 | Tragic $75,851 |