Slavic vs Dominican Median Male Earnings
COMPARE
Slavic
Dominican
Median Male Earnings
Median Male Earnings Comparison
Slavs
Dominicans
$56,390
MEDIAN MALE EARNINGS
86.5/ 100
METRIC RATING
137th/ 347
METRIC RANK
$47,204
MEDIAN MALE EARNINGS
0.1/ 100
METRIC RATING
297th/ 347
METRIC RANK
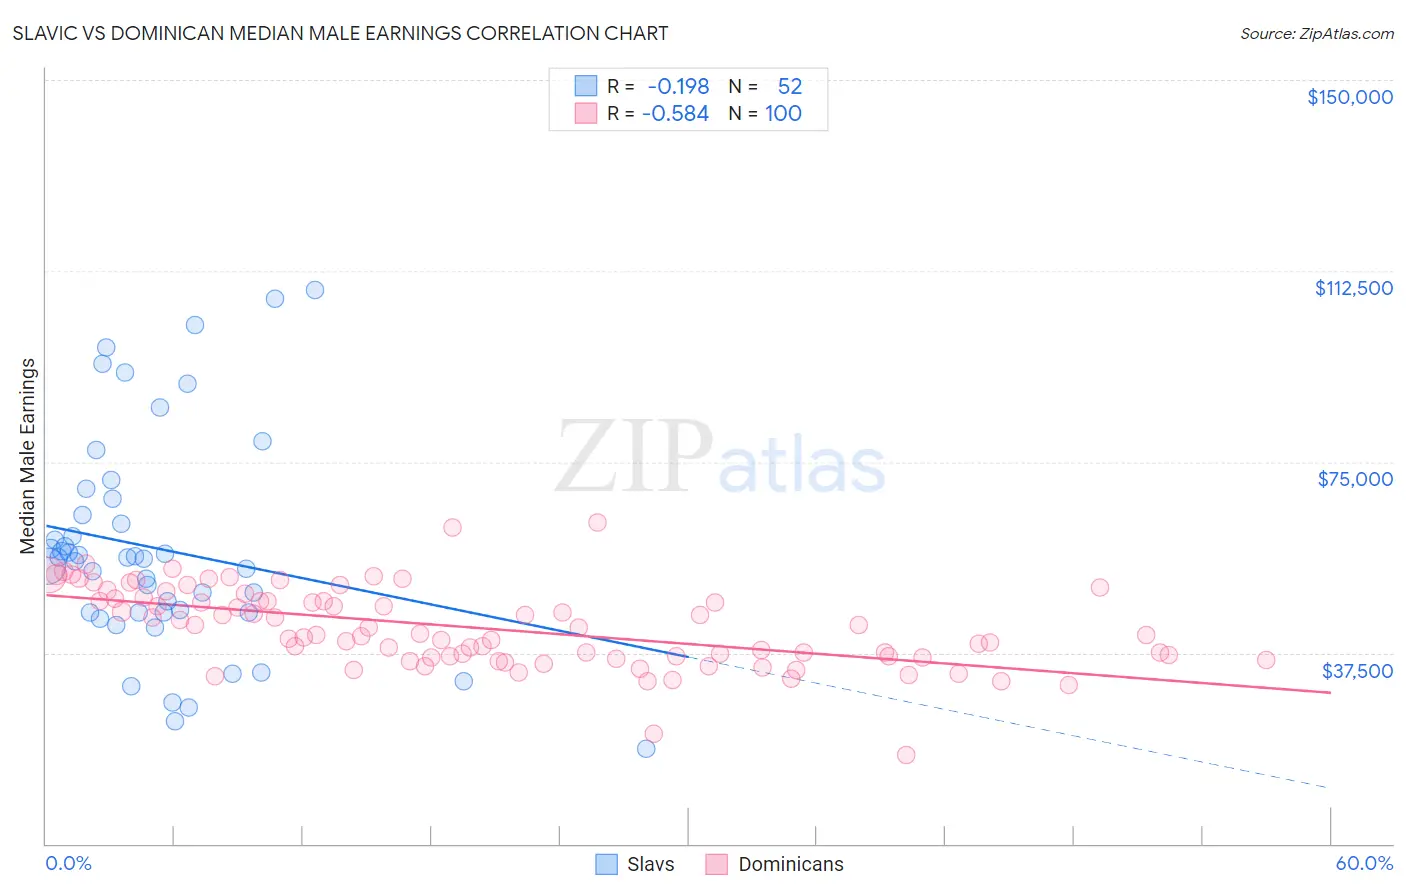
Slavic vs Dominican Median Male Earnings Correlation Chart
The statistical analysis conducted on geographies consisting of 270,818,256 people shows a poor negative correlation between the proportion of Slavs and median male earnings in the United States with a correlation coefficient (R) of -0.198 and weighted average of $56,390. Similarly, the statistical analysis conducted on geographies consisting of 355,000,212 people shows a substantial negative correlation between the proportion of Dominicans and median male earnings in the United States with a correlation coefficient (R) of -0.584 and weighted average of $47,204, a difference of 19.5%.
Median Male Earnings Correlation Summary
| Measurement | Slavic | Dominican |
| Minimum | $18,676 | $17,436 |
| Maximum | $108,806 | $62,989 |
| Range | $90,130 | $45,553 |
| Mean | $57,922 | $42,393 |
| Median | $56,132 | $41,223 |
| Interquartile 25% (IQ1) | $45,442 | $36,717 |
| Interquartile 75% (IQ3) | $66,210 | $47,976 |
| Interquartile Range (IQR) | $20,768 | $11,259 |
| Standard Deviation (Sample) | $21,311 | $7,882 |
| Standard Deviation (Population) | $21,105 | $7,843 |
Similar Demographics by Median Male Earnings
Demographics Similar to Slavs by Median Male Earnings
In terms of median male earnings, the demographic groups most similar to Slavs are Immigrants from Saudi Arabia ($56,452, a difference of 0.11%), Irish ($56,464, a difference of 0.13%), Slovak ($56,306, a difference of 0.15%), Zimbabwean ($56,302, a difference of 0.16%), and Luxembourger ($56,300, a difference of 0.16%).
| Demographics | Rating | Rank | Median Male Earnings |
| Koreans | 89.4 /100 | #130 | Excellent $56,672 |
| Portuguese | 89.4 /100 | #131 | Excellent $56,663 |
| Czechs | 88.2 /100 | #132 | Excellent $56,546 |
| Immigrants | Germany | 88.2 /100 | #133 | Excellent $56,542 |
| Moroccans | 87.7 /100 | #134 | Excellent $56,499 |
| Irish | 87.4 /100 | #135 | Excellent $56,464 |
| Immigrants | Saudi Arabia | 87.2 /100 | #136 | Excellent $56,452 |
| Slavs | 86.5 /100 | #137 | Excellent $56,390 |
| Slovaks | 85.5 /100 | #138 | Excellent $56,306 |
| Zimbabweans | 85.5 /100 | #139 | Excellent $56,302 |
| Luxembourgers | 85.5 /100 | #140 | Excellent $56,300 |
| Danes | 84.8 /100 | #141 | Excellent $56,246 |
| Ethiopians | 84.8 /100 | #142 | Excellent $56,243 |
| Sri Lankans | 83.4 /100 | #143 | Excellent $56,136 |
| Immigrants | Uganda | 82.4 /100 | #144 | Excellent $56,064 |
Demographics Similar to Dominicans by Median Male Earnings
In terms of median male earnings, the demographic groups most similar to Dominicans are Immigrants from Micronesia ($47,177, a difference of 0.060%), Inupiat ($47,281, a difference of 0.16%), Immigrants from Zaire ($47,070, a difference of 0.28%), U.S. Virgin Islander ($47,066, a difference of 0.29%), and Central American Indian ($47,433, a difference of 0.48%).
| Demographics | Rating | Rank | Median Male Earnings |
| Immigrants | Belize | 0.1 /100 | #290 | Tragic $47,809 |
| Choctaw | 0.1 /100 | #291 | Tragic $47,729 |
| Immigrants | Dominica | 0.1 /100 | #292 | Tragic $47,651 |
| Indonesians | 0.1 /100 | #293 | Tragic $47,503 |
| Immigrants | Nicaragua | 0.1 /100 | #294 | Tragic $47,482 |
| Central American Indians | 0.1 /100 | #295 | Tragic $47,433 |
| Inupiat | 0.1 /100 | #296 | Tragic $47,281 |
| Dominicans | 0.1 /100 | #297 | Tragic $47,204 |
| Immigrants | Micronesia | 0.1 /100 | #298 | Tragic $47,177 |
| Immigrants | Zaire | 0.1 /100 | #299 | Tragic $47,070 |
| U.S. Virgin Islanders | 0.1 /100 | #300 | Tragic $47,066 |
| Immigrants | Latin America | 0.1 /100 | #301 | Tragic $46,941 |
| Seminole | 0.1 /100 | #302 | Tragic $46,783 |
| Yaqui | 0.1 /100 | #303 | Tragic $46,777 |
| Bangladeshis | 0.1 /100 | #304 | Tragic $46,744 |